SPY: The $676.67 Zero Gamma Pivot Decides Everything Today
SPY: The $676.67 Zero Gamma Pivot Decides Everything Today
📊 MARKET OVERVIEW
The options market for SPY and QQQ opens today in a critical state, marked by a Net GEX of $0.00 Billion for both indices. This neutral gamma positioning implies that market makers are currently in a balanced hedging state, neither heavily long nor short gamma. Historically, a neutral Net GEX environment often precedes a period of increased volatility, as the stabilizing force of positive gamma (dealers buying dips, selling rips) is absent. We are precisely at the inflection point, with the potential for rapid price expansion if key levels are breached.
For SPY, the current spot price of $676.33 hovers directly at the Zero Gamma Pivot of $676.67. This is a highly significant technical and options-derived level. When the market is at or near zero gamma, minor directional impulses can be amplified, as dealer hedging shifts from counter-trending to trend-following. Above this level, dealers typically become long gamma, creating a dampening effect on volatility. Below it, they become short gamma, exacerbating price movements. Today, given the neutral Net GEX, we anticipate that any sustained move away from $676.67 will be met with accelerated momentum, as gamma hedging begins to kick in directionally.
The Put/Call Imbalance Ratio for SPY stands at 0.50, indicating a slight preference for calls over puts, though not overwhelmingly so. For QQQ, the ratio is 0.00, suggesting a perfect balance between puts and calls. This balanced positioning, combined with the neutral Net GEX, suggests that market participants are not overwhelmingly biased in either direction, further emphasizing the importance of the Zero Gamma Pivot as the determinant of today's price action. The VIX closed at 25.62, reflecting elevated implied volatility, which is consistent with the current neutral gamma environment where larger price swings are more probable. This elevated VIX, coupled with the zero-gamma state, sets the stage for a potentially volatile trading session, where breaches of structural levels could lead to significant moves.
🎯 KEY STRUCTURAL LEVELS
Understanding the precise structural levels derived from options gamma is crucial for navigating today's market. These levels represent points where market makers are expected to engage in significant hedging activity, either providing support, acting as resistance, or accelerating price movements.
| Index | Spot Price | Call Wall (Resistance) | Put Wall (Support) | Zero Gamma Pivot (Vol Expansion) | Max Pain |
| SPY | $676.33 | $688 | $665 | $676.67 | $676 |
| QQQ | $607.69 | $617 | $600 | $608.00 | $607 |
SPY Analysis:
The SPY is currently trading at $676.33, directly abutting its Zero Gamma Pivot at $676.67. This is the most critical level for today. As discussed, with Net GEX at $0.00 Billion, a sustained move above $676.67 would likely shift dealers to a long-gamma position, dampening volatility and potentially creating a ceiling as they sell rallies. Conversely, a sustained move below $676.67 would push dealers into a short-gamma position, accelerating downside momentum as they sell into weakness. The Call Wall at $688 represents significant resistance, where large call open interest clusters would force dealers to sell into rallies to remain delta-neutral. Conversely, the Put Wall at $665 acts as a robust support level, where substantial put open interest would compel dealers to buy into dips. Max Pain for SPY is $676, indicating where the majority of options contracts would expire worthless, often acting as a magnet for price action if within range.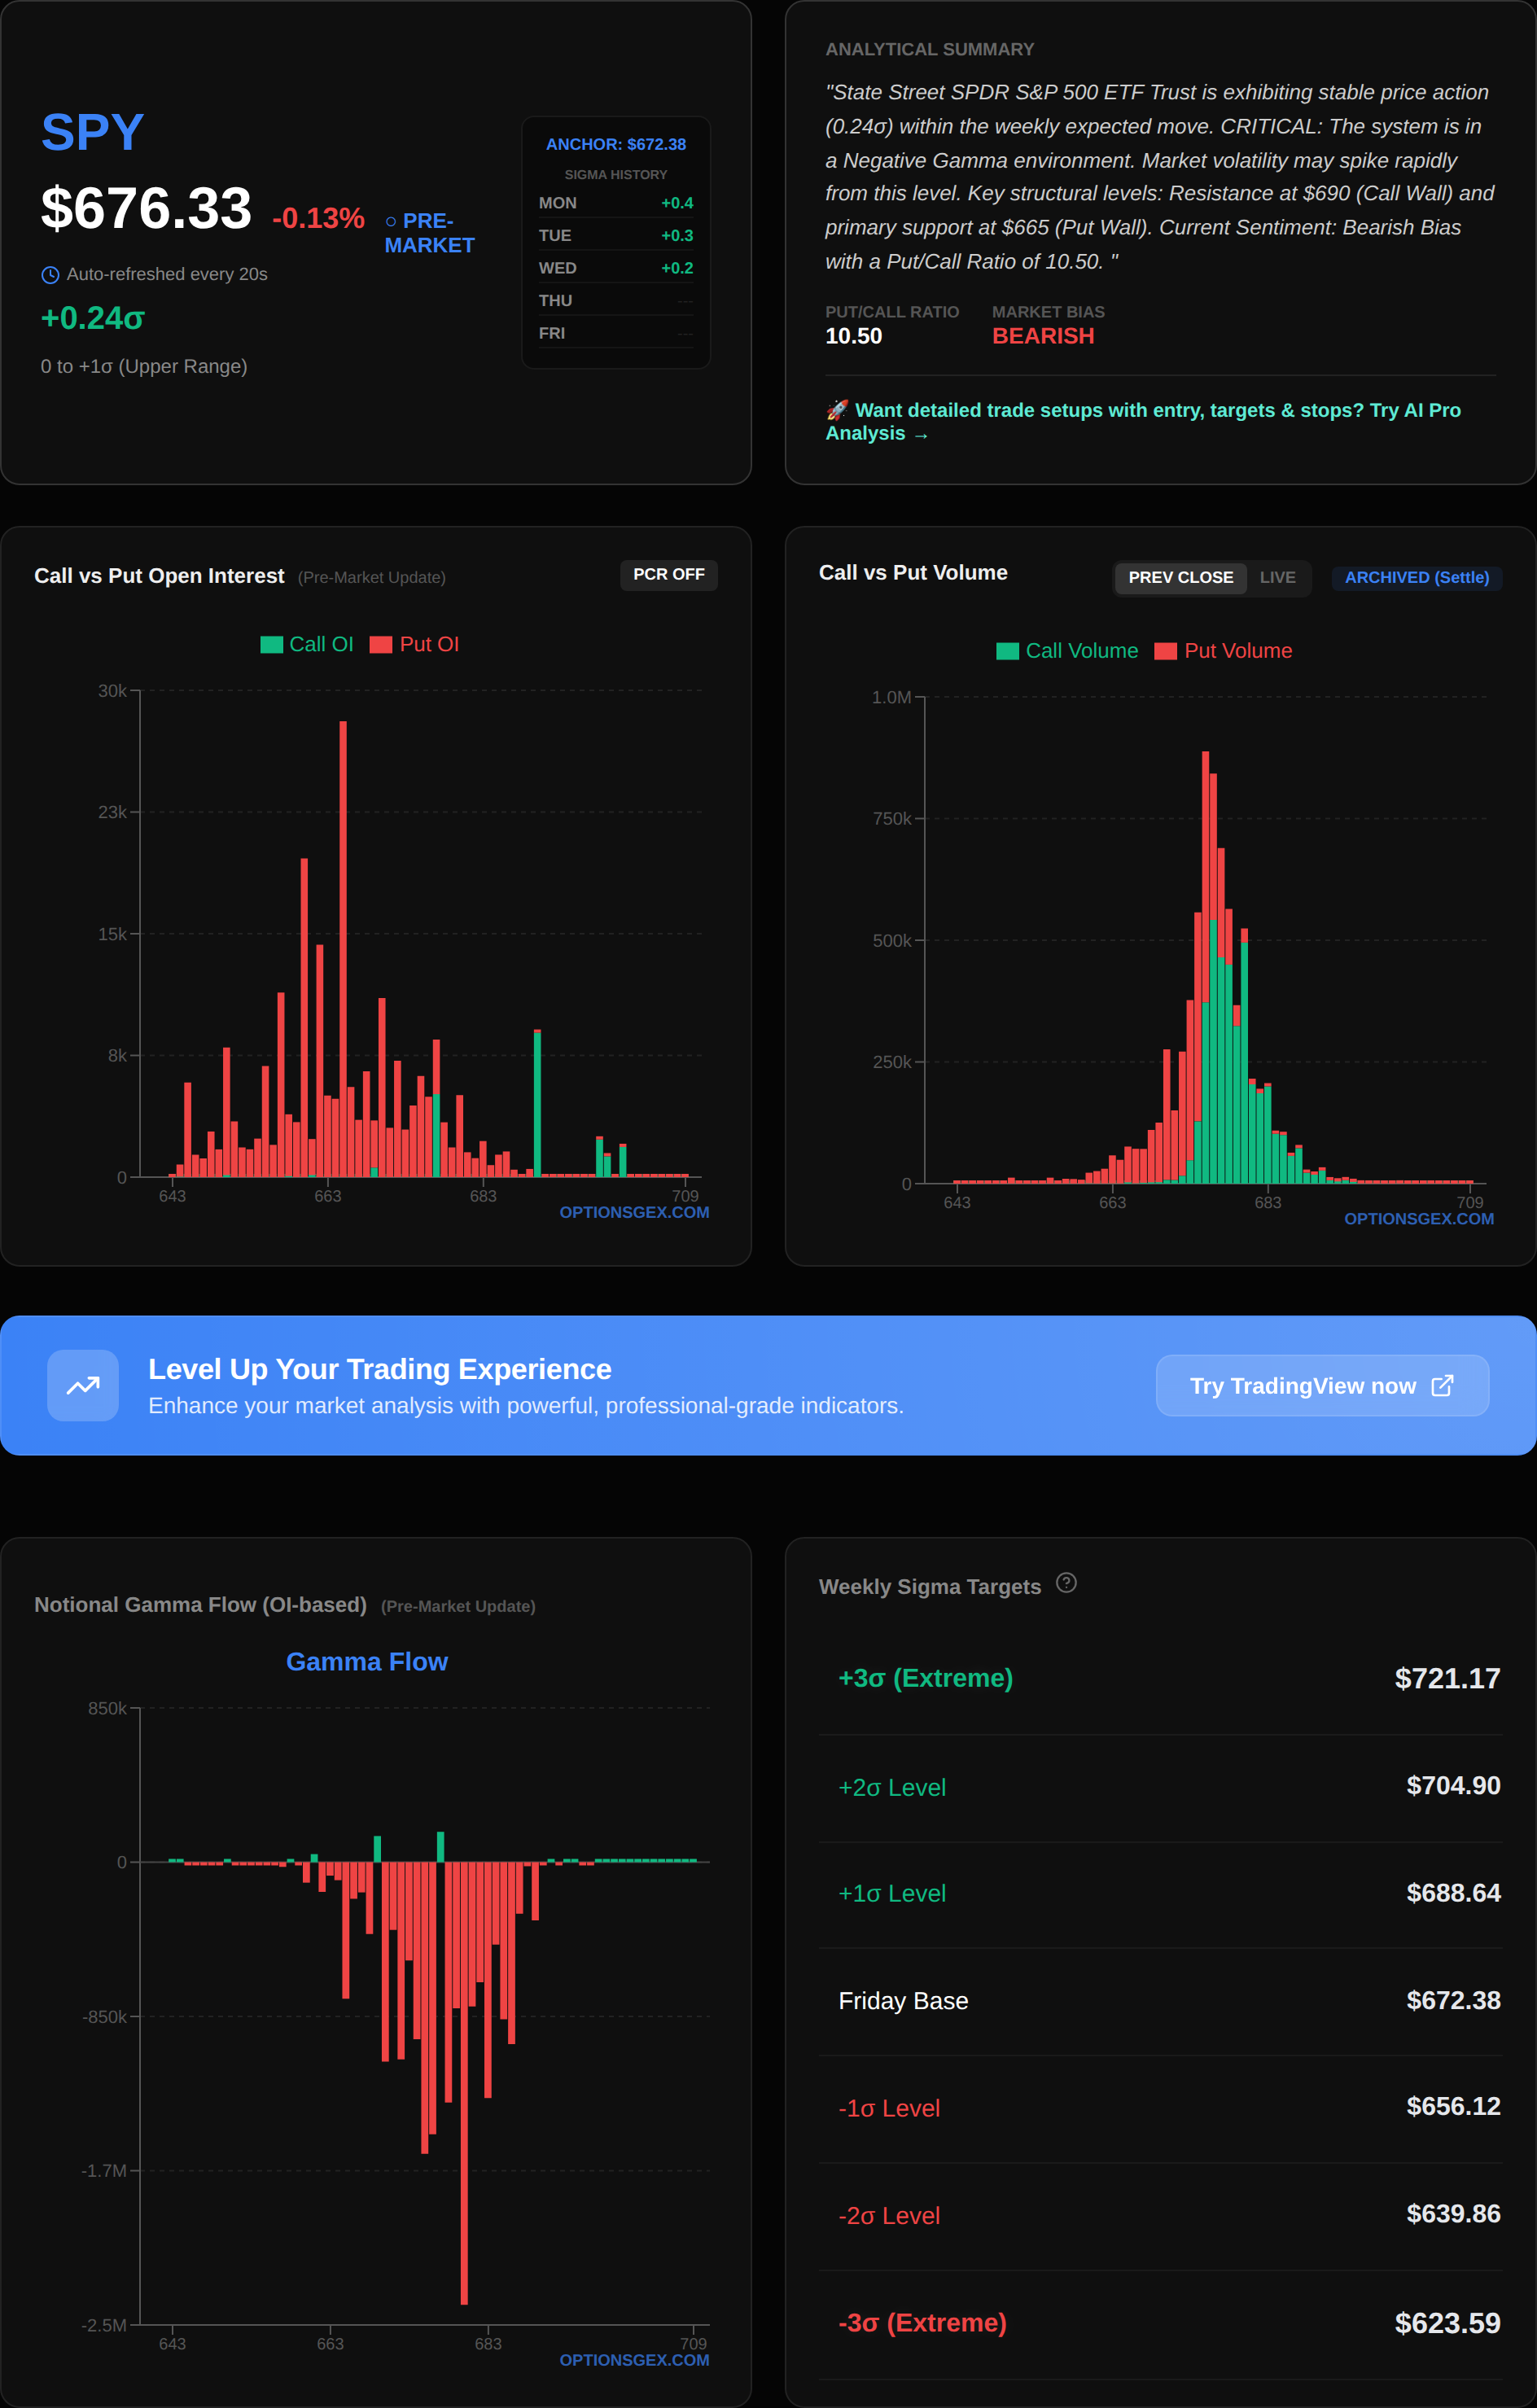
QQQ Analysis:
QQQ is trading at $607.69, also very close to its Zero Gamma Pivot at $608.00. Similar to SPY, this level is paramount for determining QQQ's directional bias and volatility for the day. Above $608.00, expect a more controlled ascent, while below it, downside acceleration is probable. The Call Wall at $617 is a formidable resistance point, reflecting significant call option concentration that would trigger dealer selling. The Put Wall at $600 provides strong support, indicating where dealer buying would likely intensify. Max Pain for QQQ is $607, aligning closely with the current spot and zero gamma, reinforcing the potential for price to gravitate towards this level.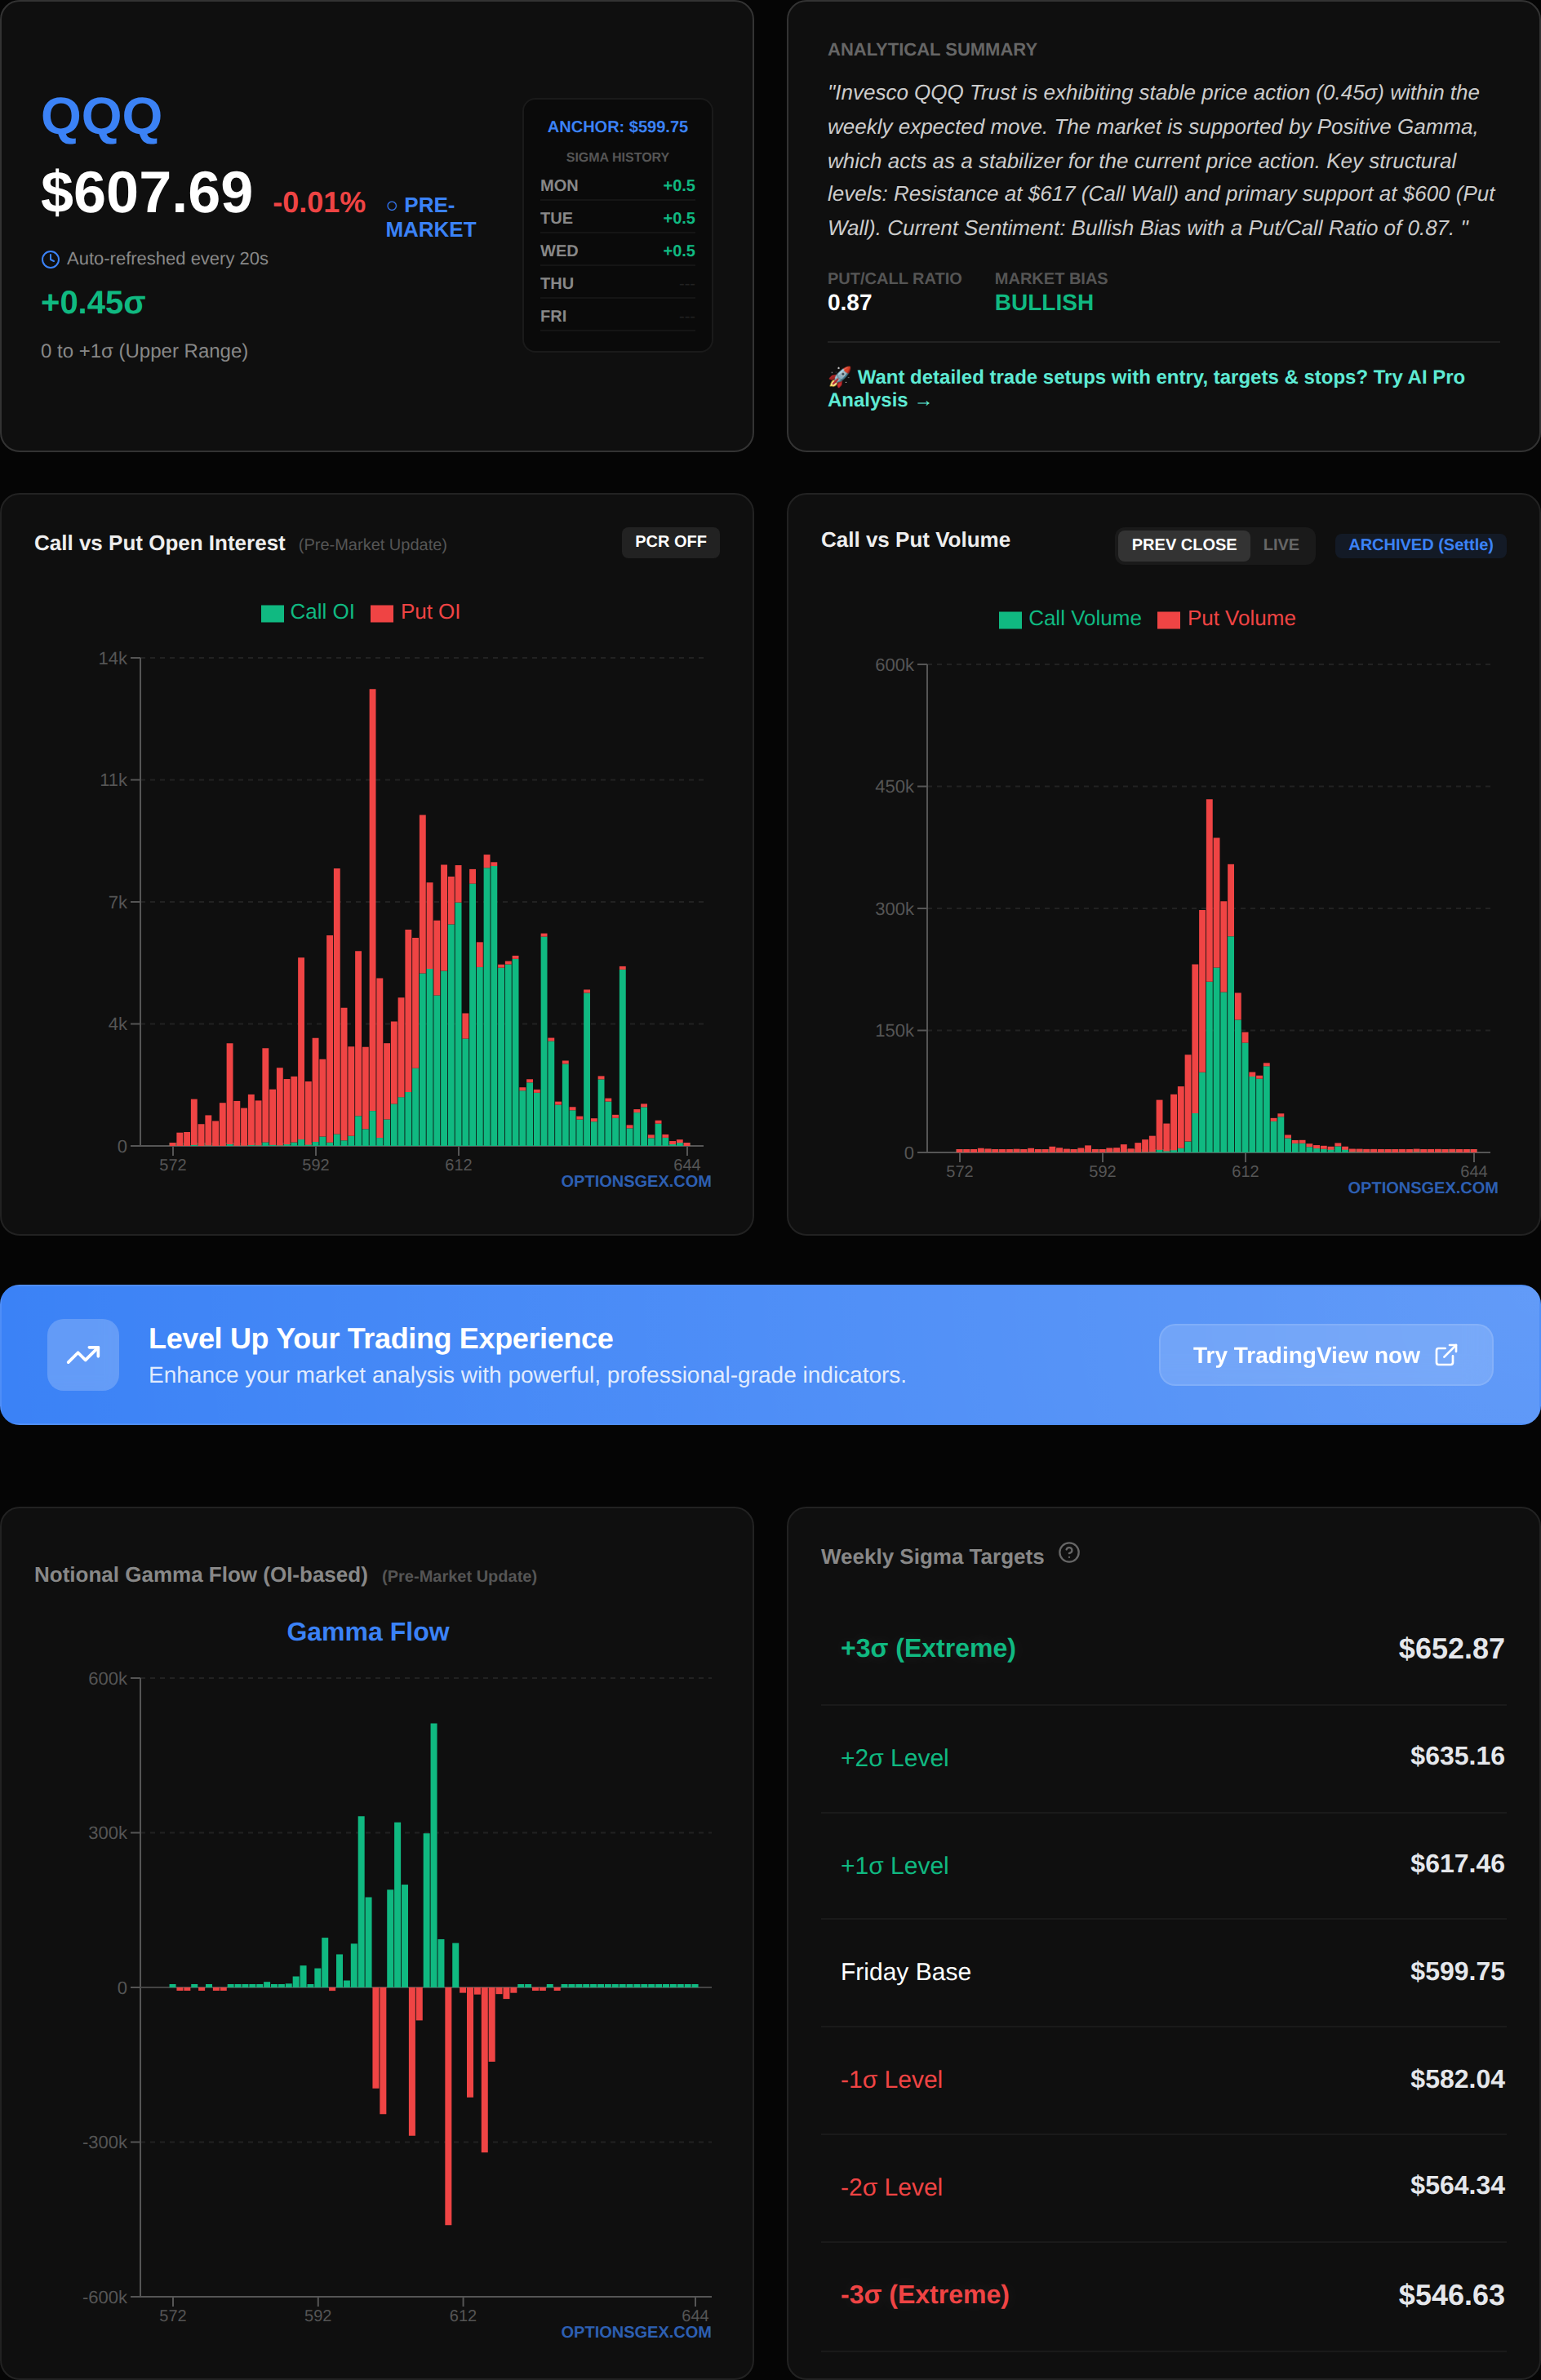
These levels are not merely static points but dynamic zones of potential market maker hedging activity, dictating the ebb and flow of volatility and price direction.
🔥 UNUSUAL FLOW RADAR: Today's Smart Money Targets
TSLA: Volatility on the Horizon
TSLA, currently at $407.82, is flashing significant unusual options activity, particularly on the put side, indicating potential downside pressure or hedging against it. The overall Net GEX for TSLA is $-0.00 Billion, suggesting a neutral to slightly negative gamma environment that could amplify price swings. The Call Wall is exceptionally high at $680, while the Put Wall is at $120, indicating a very wide implied trading range, but within the near term, the unusual activity demands attention.
📊 Analyze any ticker yourself: Visit optionsgex.com to view live GEX profiles and Sigma levels for over 500 stocks.
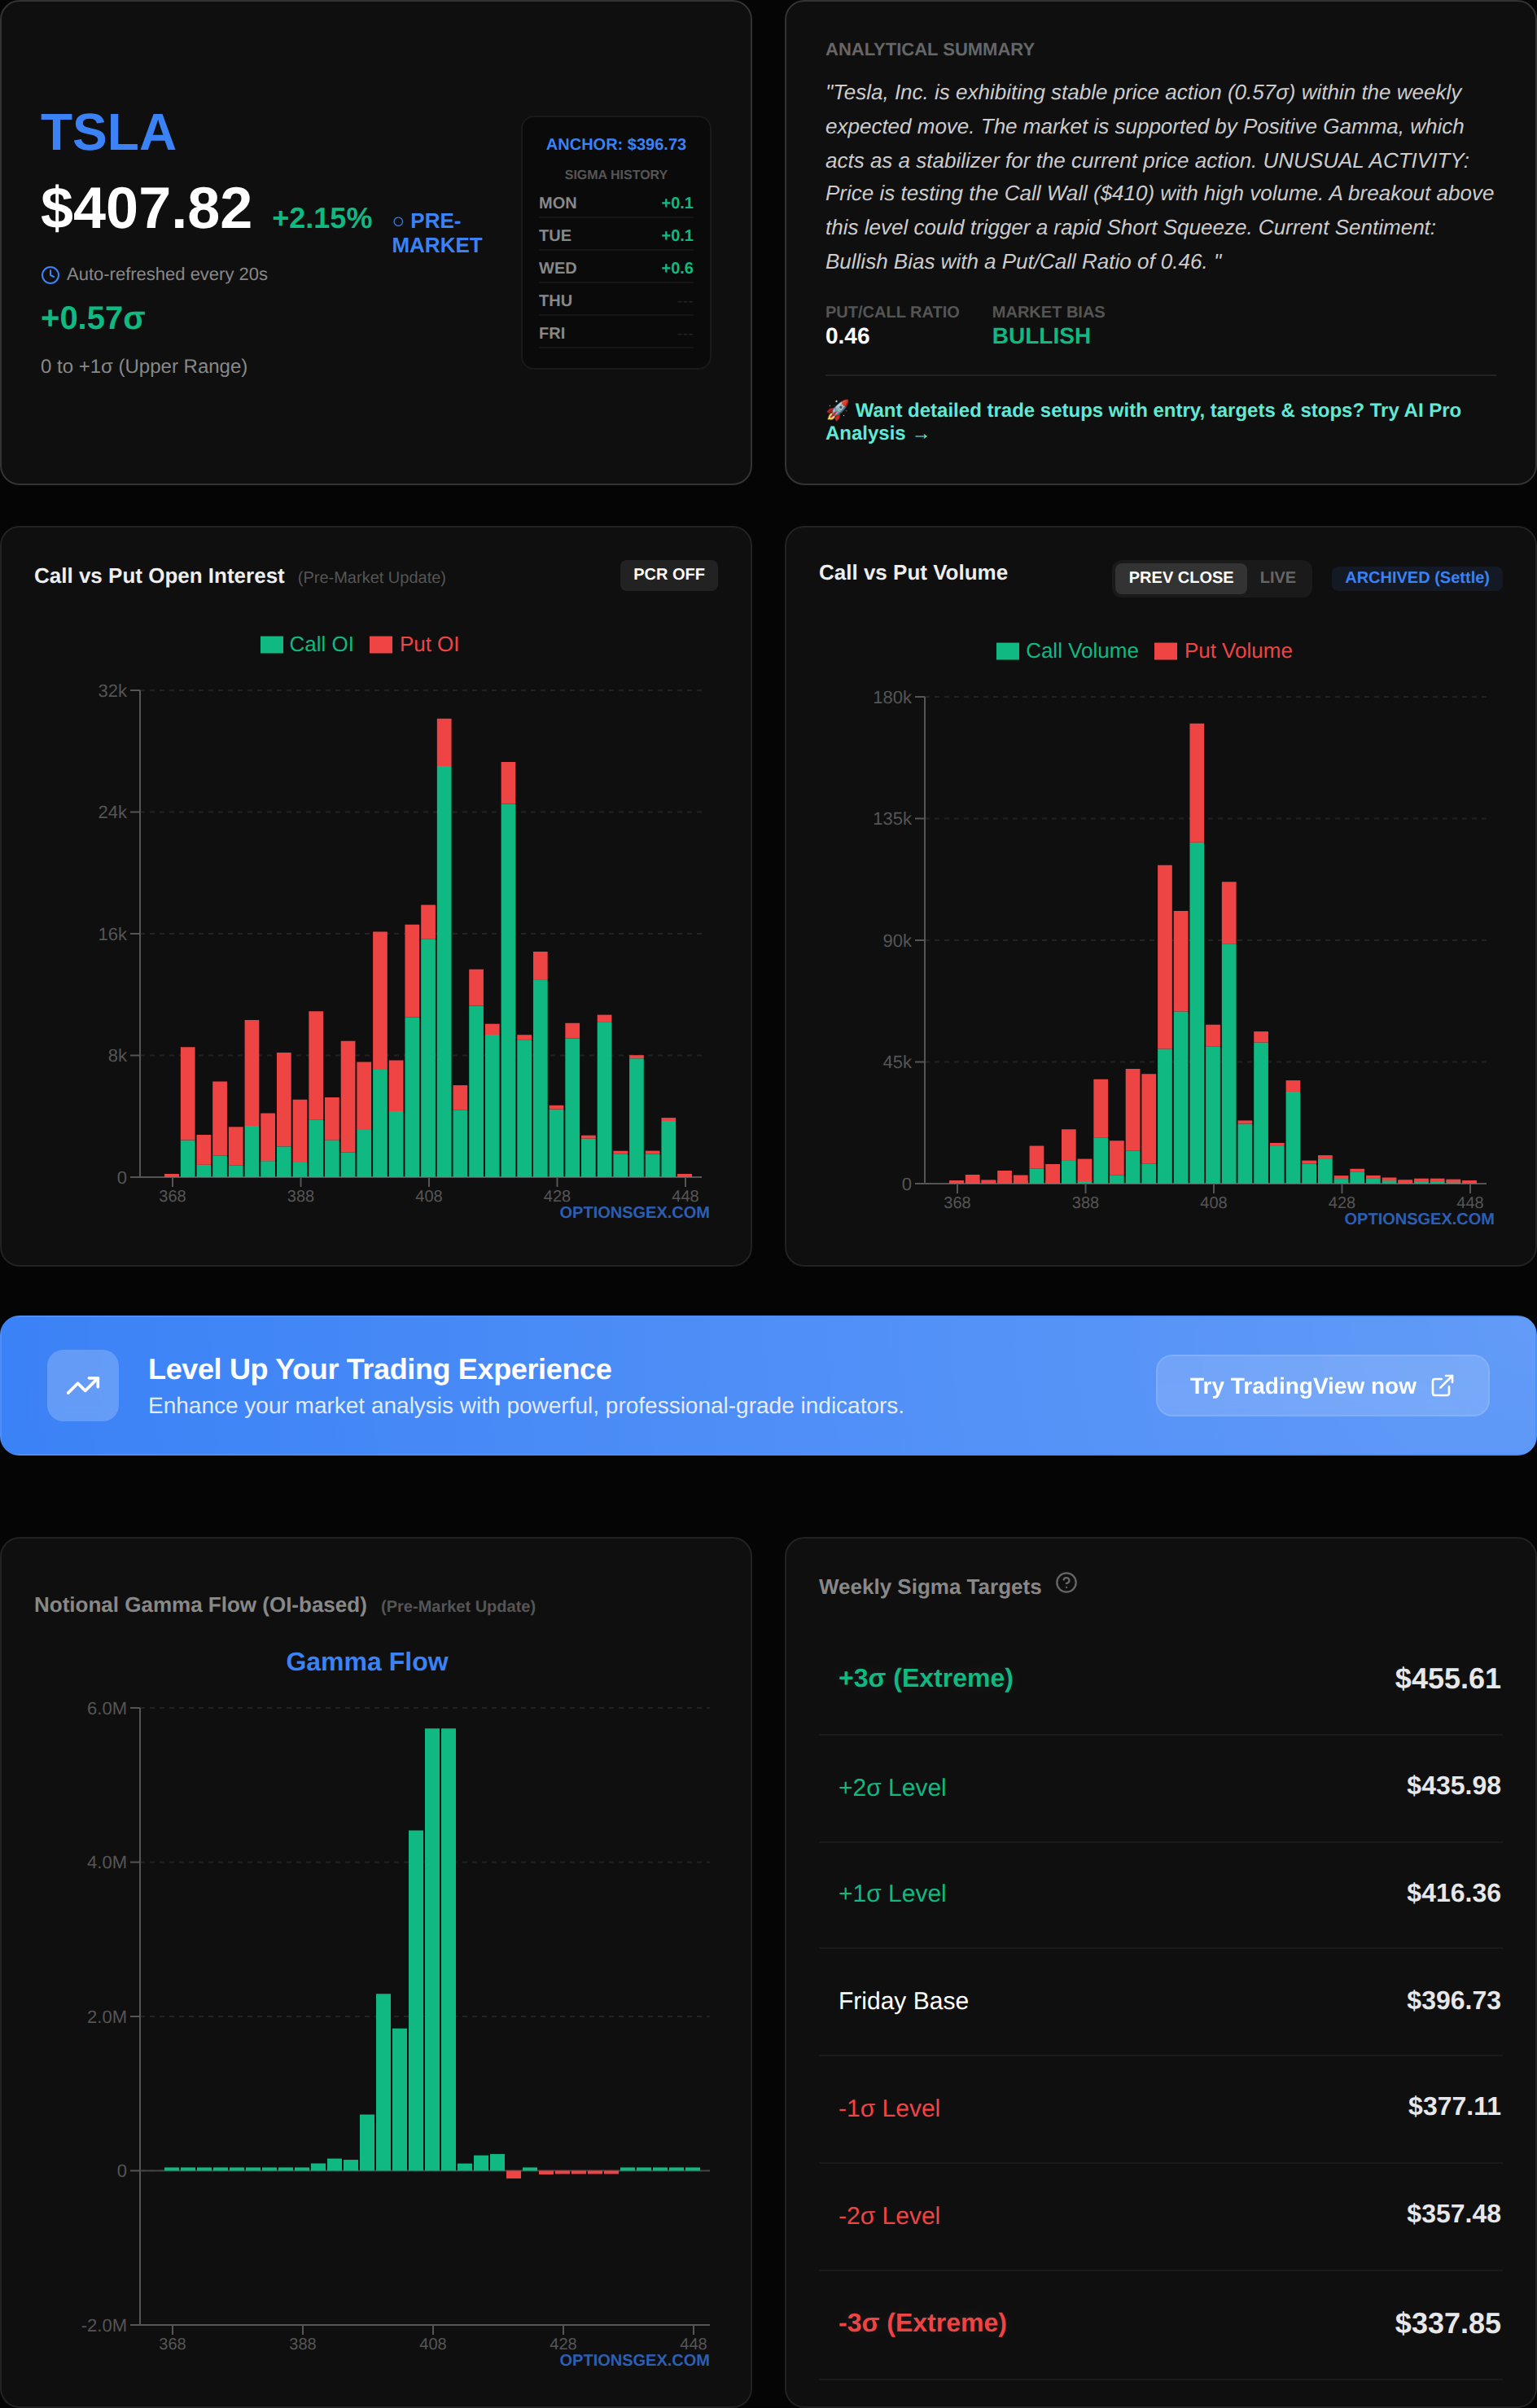
The most striking activity is seen at the PUT Strike $407.5, with a volume of 19,612 against an open interest of 2,258. This represents an extraordinary 8.7x normal volume-to-OI ratio. Such a high ratio typically signals a significant new positioning, rather than just closing or rolling existing trades. With gamma at 0.0005 and an IV of 0.4%, this flow suggests aggressive downside protection or a bearish speculative bet very close to the current spot price. Simultaneously, the PUT Strike $405 also saw substantial activity, with 29,094 volume vs 6,083 OI, a 4.8x ratio, carrying a gamma of 0.0001 and IV of 3.1%. These two put strikes, both out of the money, indicate a strong hedging interest or outright bearish conviction targeting the immediate downside.
On the call side, the CALL Strike $412.5 saw 25,420 volume vs 4,402 OI, a 5.8x ratio, with gamma at 0.0000 and IV at 3.1%. While this indicates some bullish interest, the gamma profile suggests it's further out-of-the-money and less impactful on immediate price action than the puts. The clustering of gamma is very low across these strikes, meaning these are not "gamma magnet" levels but rather directional bets.
Actionable Trade Idea / Risk Warning: Given the overwhelming put activity near the current spot, a break below $407.5 could trigger accelerated selling, as dealers shorting these puts would need to sell TSLA shares to hedge their delta. Traders should monitor $407.5 as a key intraday support. A confirmed break with conviction below this level could target $405 and potentially lower. A bearish sentiment is building, despite the wide overall gamma walls. Consider a short position on a break below $407.5 with a stop loss just above $408.5, targeting $405 and then potentially $402.5.
META: Bullish Divergence with High Gamma Call
META, trading at $654.86, presents a fascinating divergence in options flow. The overall Net GEX is a healthy $3.02 Billion, indicating a positive gamma environment where market makers are likely to buy dips and sell rallies, generally dampening volatility. The Call Wall at $665 and Put Wall at $600 define a clear range for dealer hedging.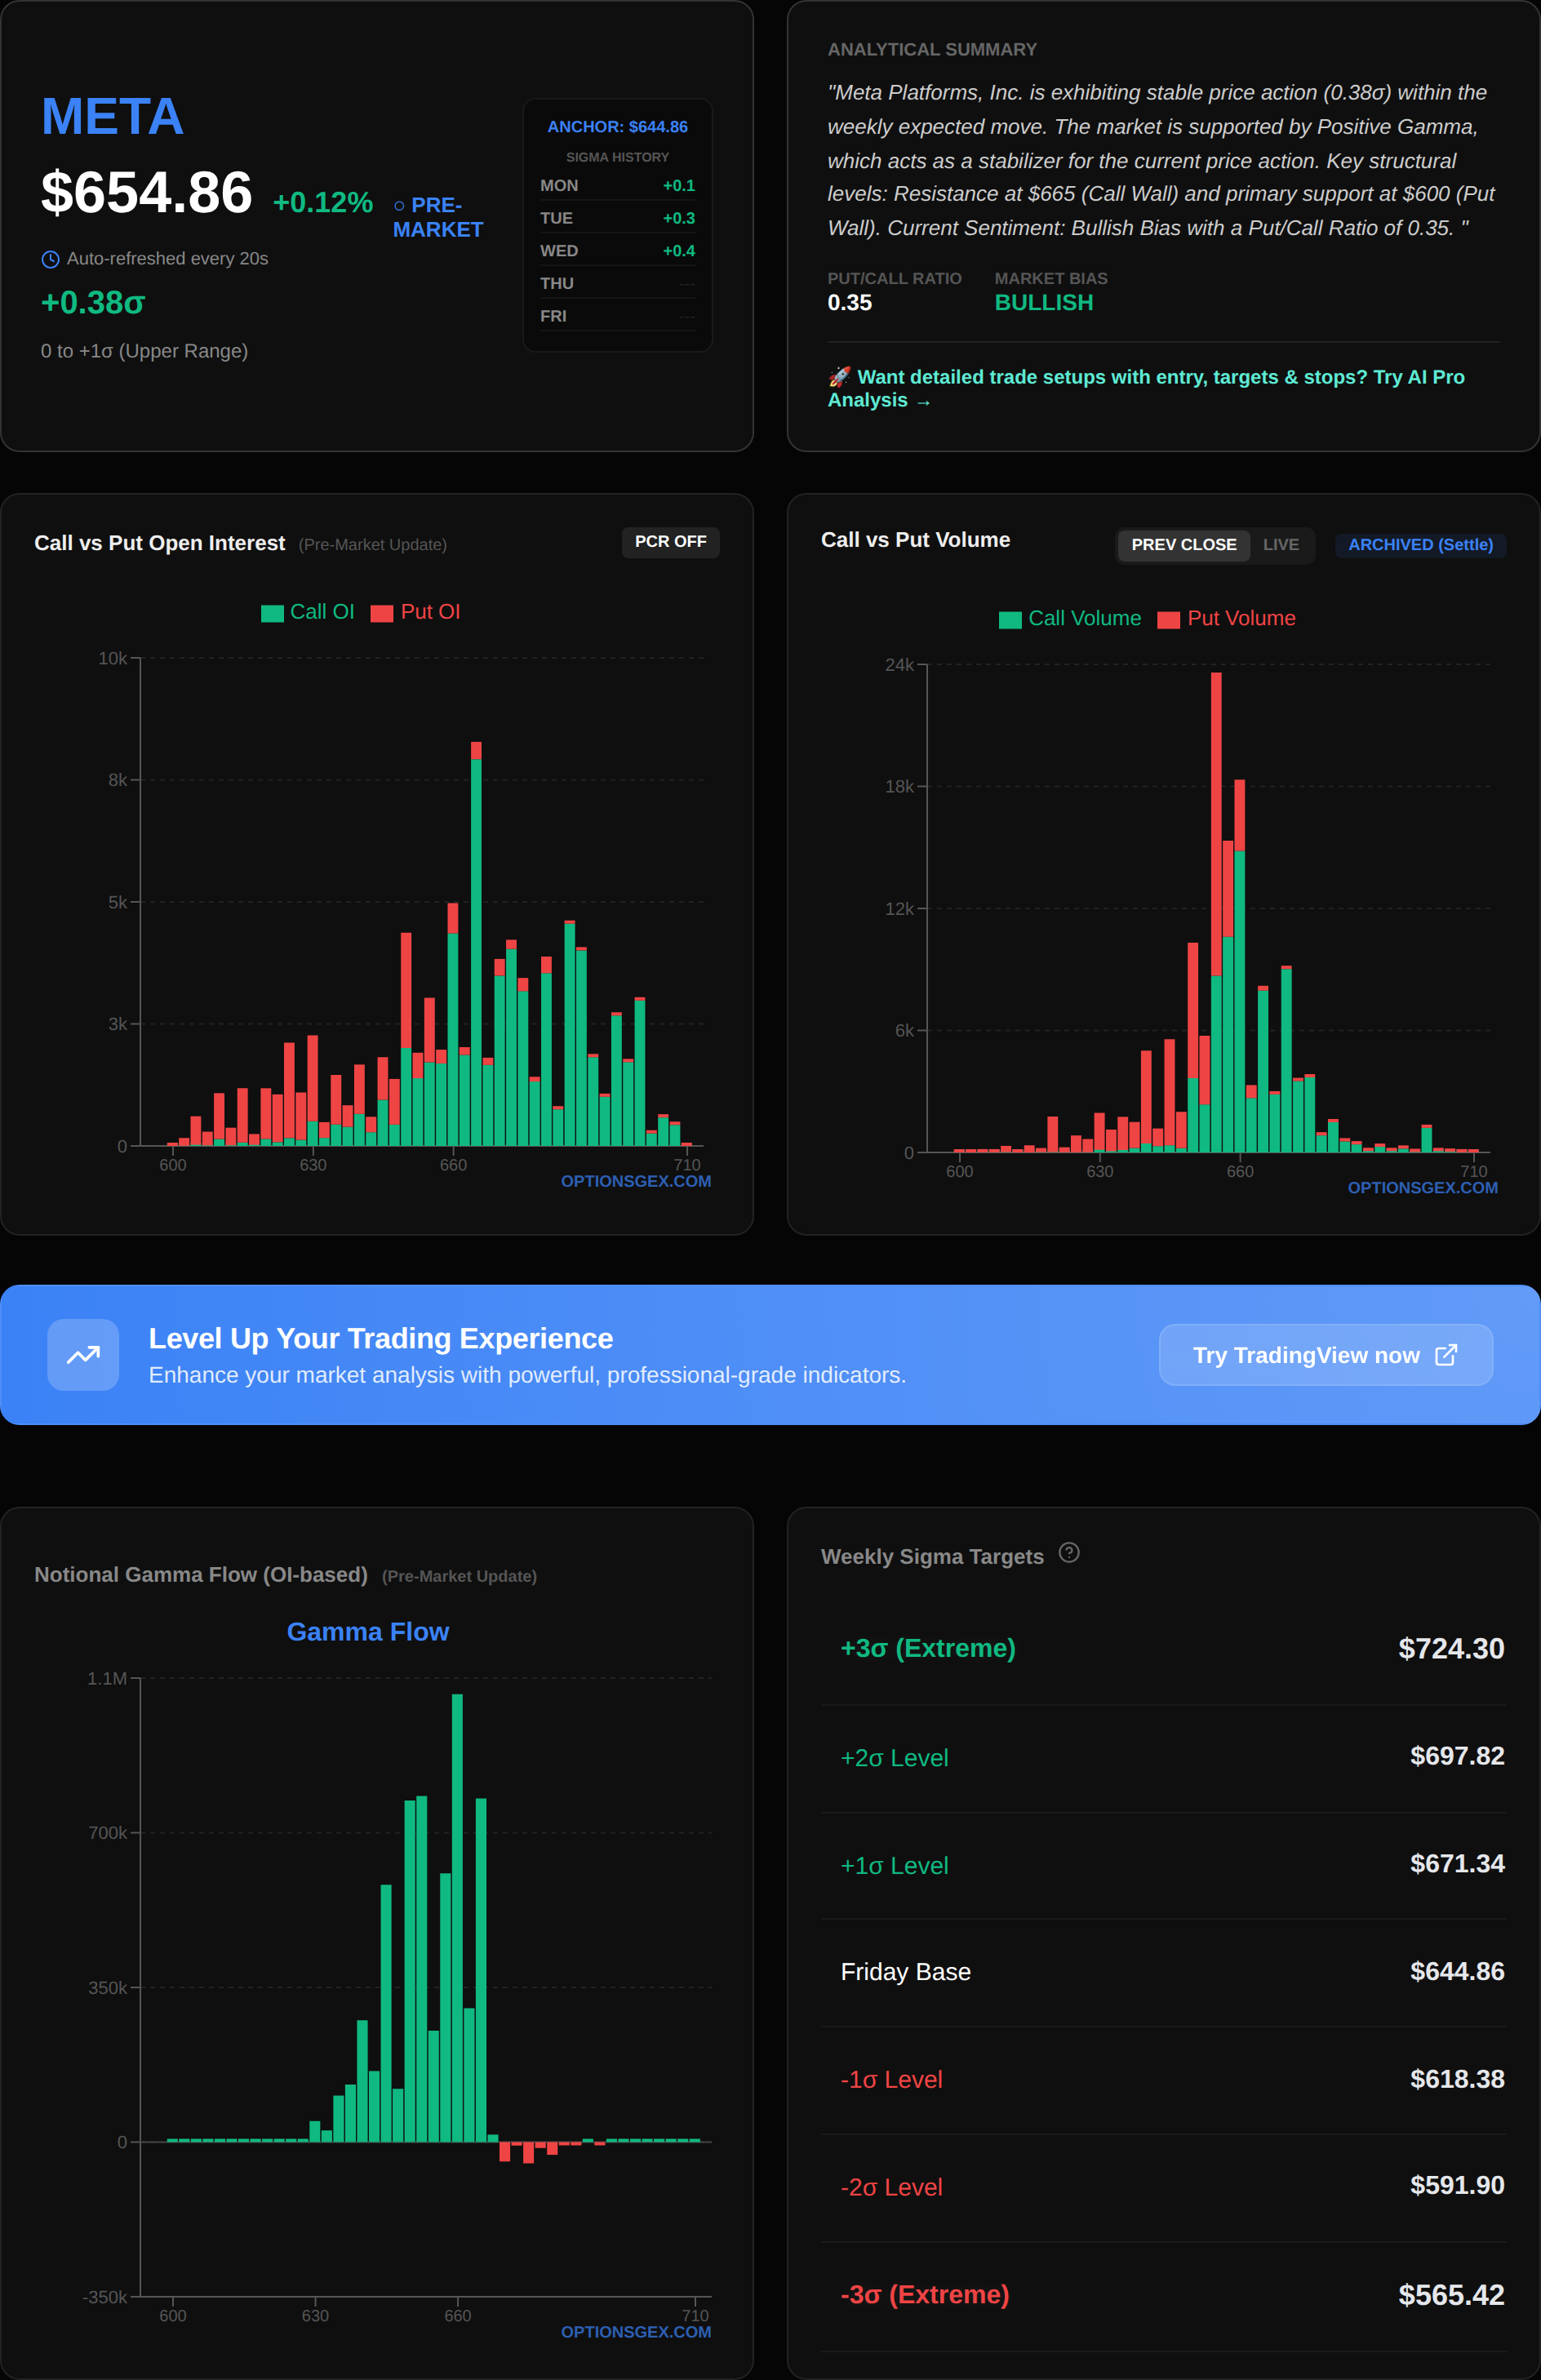
Despite the positive overall gamma, we observe significant put activity. The PUT Strike $650 saw 14,350 volume vs 2,365 OI, a 6.1x ratio, with gamma at 0.0000 and IV at 3.1%. This suggests significant downside hedging or speculative bearishness targeting a slight pullback. Similarly, the PUT Strike $652.5 recorded 2,934 volume vs 523 OI, a 5.6x ratio, with gamma at 0.0001 and IV at 1.6%. These flows indicate some apprehension around the current price, potentially anticipating a minor retracement.
However, the most critical flow is at the CALL Strike $655, which saw 5,207 volume vs 1,714 OI, a 3.0x ratio. Crucially, this strike boasts a gamma of 4.1094 and an IV of 0.1%. This is an extremely high gamma value, indicating that this call strike is very close to the money and highly sensitive to price changes. A 3.0x volume-to-OI ratio suggests new, aggressive positioning. The high gamma clustered at $655 means market makers who sold these calls will rapidly become very short delta if META moves above $655, forcing them to buy META shares to hedge. This creates a powerful "gamma squeeze" potential.
Actionable Trade Idea: The high gamma at the $655 CALL strike is a major bullish signal. If META can sustain a break above $655, expect rapid acceleration to the upside as dealers are forced to buy shares. This could easily drive META towards its Call Wall at $665. Consider a long position in META on a confirmed breakout above $655, with a tight stop loss at $654. The initial target would be $660, with potential for $665. The overall positive Net GEX for META further supports a controlled upward move once this gamma level is breached.
⚠️ TRADING SCENARIOS
Given the neutral Net GEX for SPY and QQQ, coupled with their respective spot prices hovering precisely at the Zero Gamma Pivots, today is set up for a decisive directional move once a key level is breached. The VIX at 25.62 confirms higher implied volatility, supporting larger intraday swings.
🟢 Bullish Case: Break Above Zero Gamma
If SPY can definitively break and hold above its Zero Gamma Pivot of $676.67, we anticipate a bullish acceleration. The trigger for this scenario is a sustained move above $677.00. In this case, market makers will likely shift into a long-gamma position, becoming buyers on dips and sellers on rips, creating a smoother upward trajectory. This move could easily target the $680 level, and if momentum persists, the Call Wall at $688 would come into play as the next major resistance. For QQQ, a similar break above its Zero Gamma Pivot of $608.00 (specifically, a hold above $608.50) would lead to a push towards its Call Wall at $617.
🔴 Bearish Case: Fall Below Zero Gamma
Conversely, if SPY fails to hold $676.67 and breaks down, especially with conviction below $676.00, we expect a bearish acceleration. The neutral Net GEX means there's little underlying gamma support, and a move below the Zero Gamma Pivot would likely push market makers into a short-gamma position. This would force them to sell into weakness, exacerbating the decline. The initial target would be $670, followed by the Put Wall at $665. For QQQ, a breakdown below $607.50 would see it target $605 and then its Put Wall at $600. This scenario would be characterized by increased downside volatility.
🟡 Choppy/Range-Bound Case: Stuck at Zero Gamma
If SPY remains trapped around its Zero Gamma Pivot of $676.67 and QQQ around $608.00, we could see a choppy, range-bound day. This scenario is less likely given the elevated VIX and neutral Net GEX, which typically precede directional moves. However, if neither the bullish nor bearish triggers are met with significant volume and conviction, SPY could consolidate within a tight range of $674.00 to $678.00. QQQ would similarly trade between $606.00 and $610.00. In this environment, market makers would likely be actively hedging small price fluctuations, preventing a sustained move in either direction. This would be a day for scalpers, focusing on quick trades off the immediate support and resistance levels around the Zero Gamma Pivot.


Comments
Post a Comment