SPY: The $680 Zero Gamma Pivot Holds the Key Today
SPY: The $680 Zero Gamma Pivot Holds the Key Today
📊 MARKET OVERVIEW
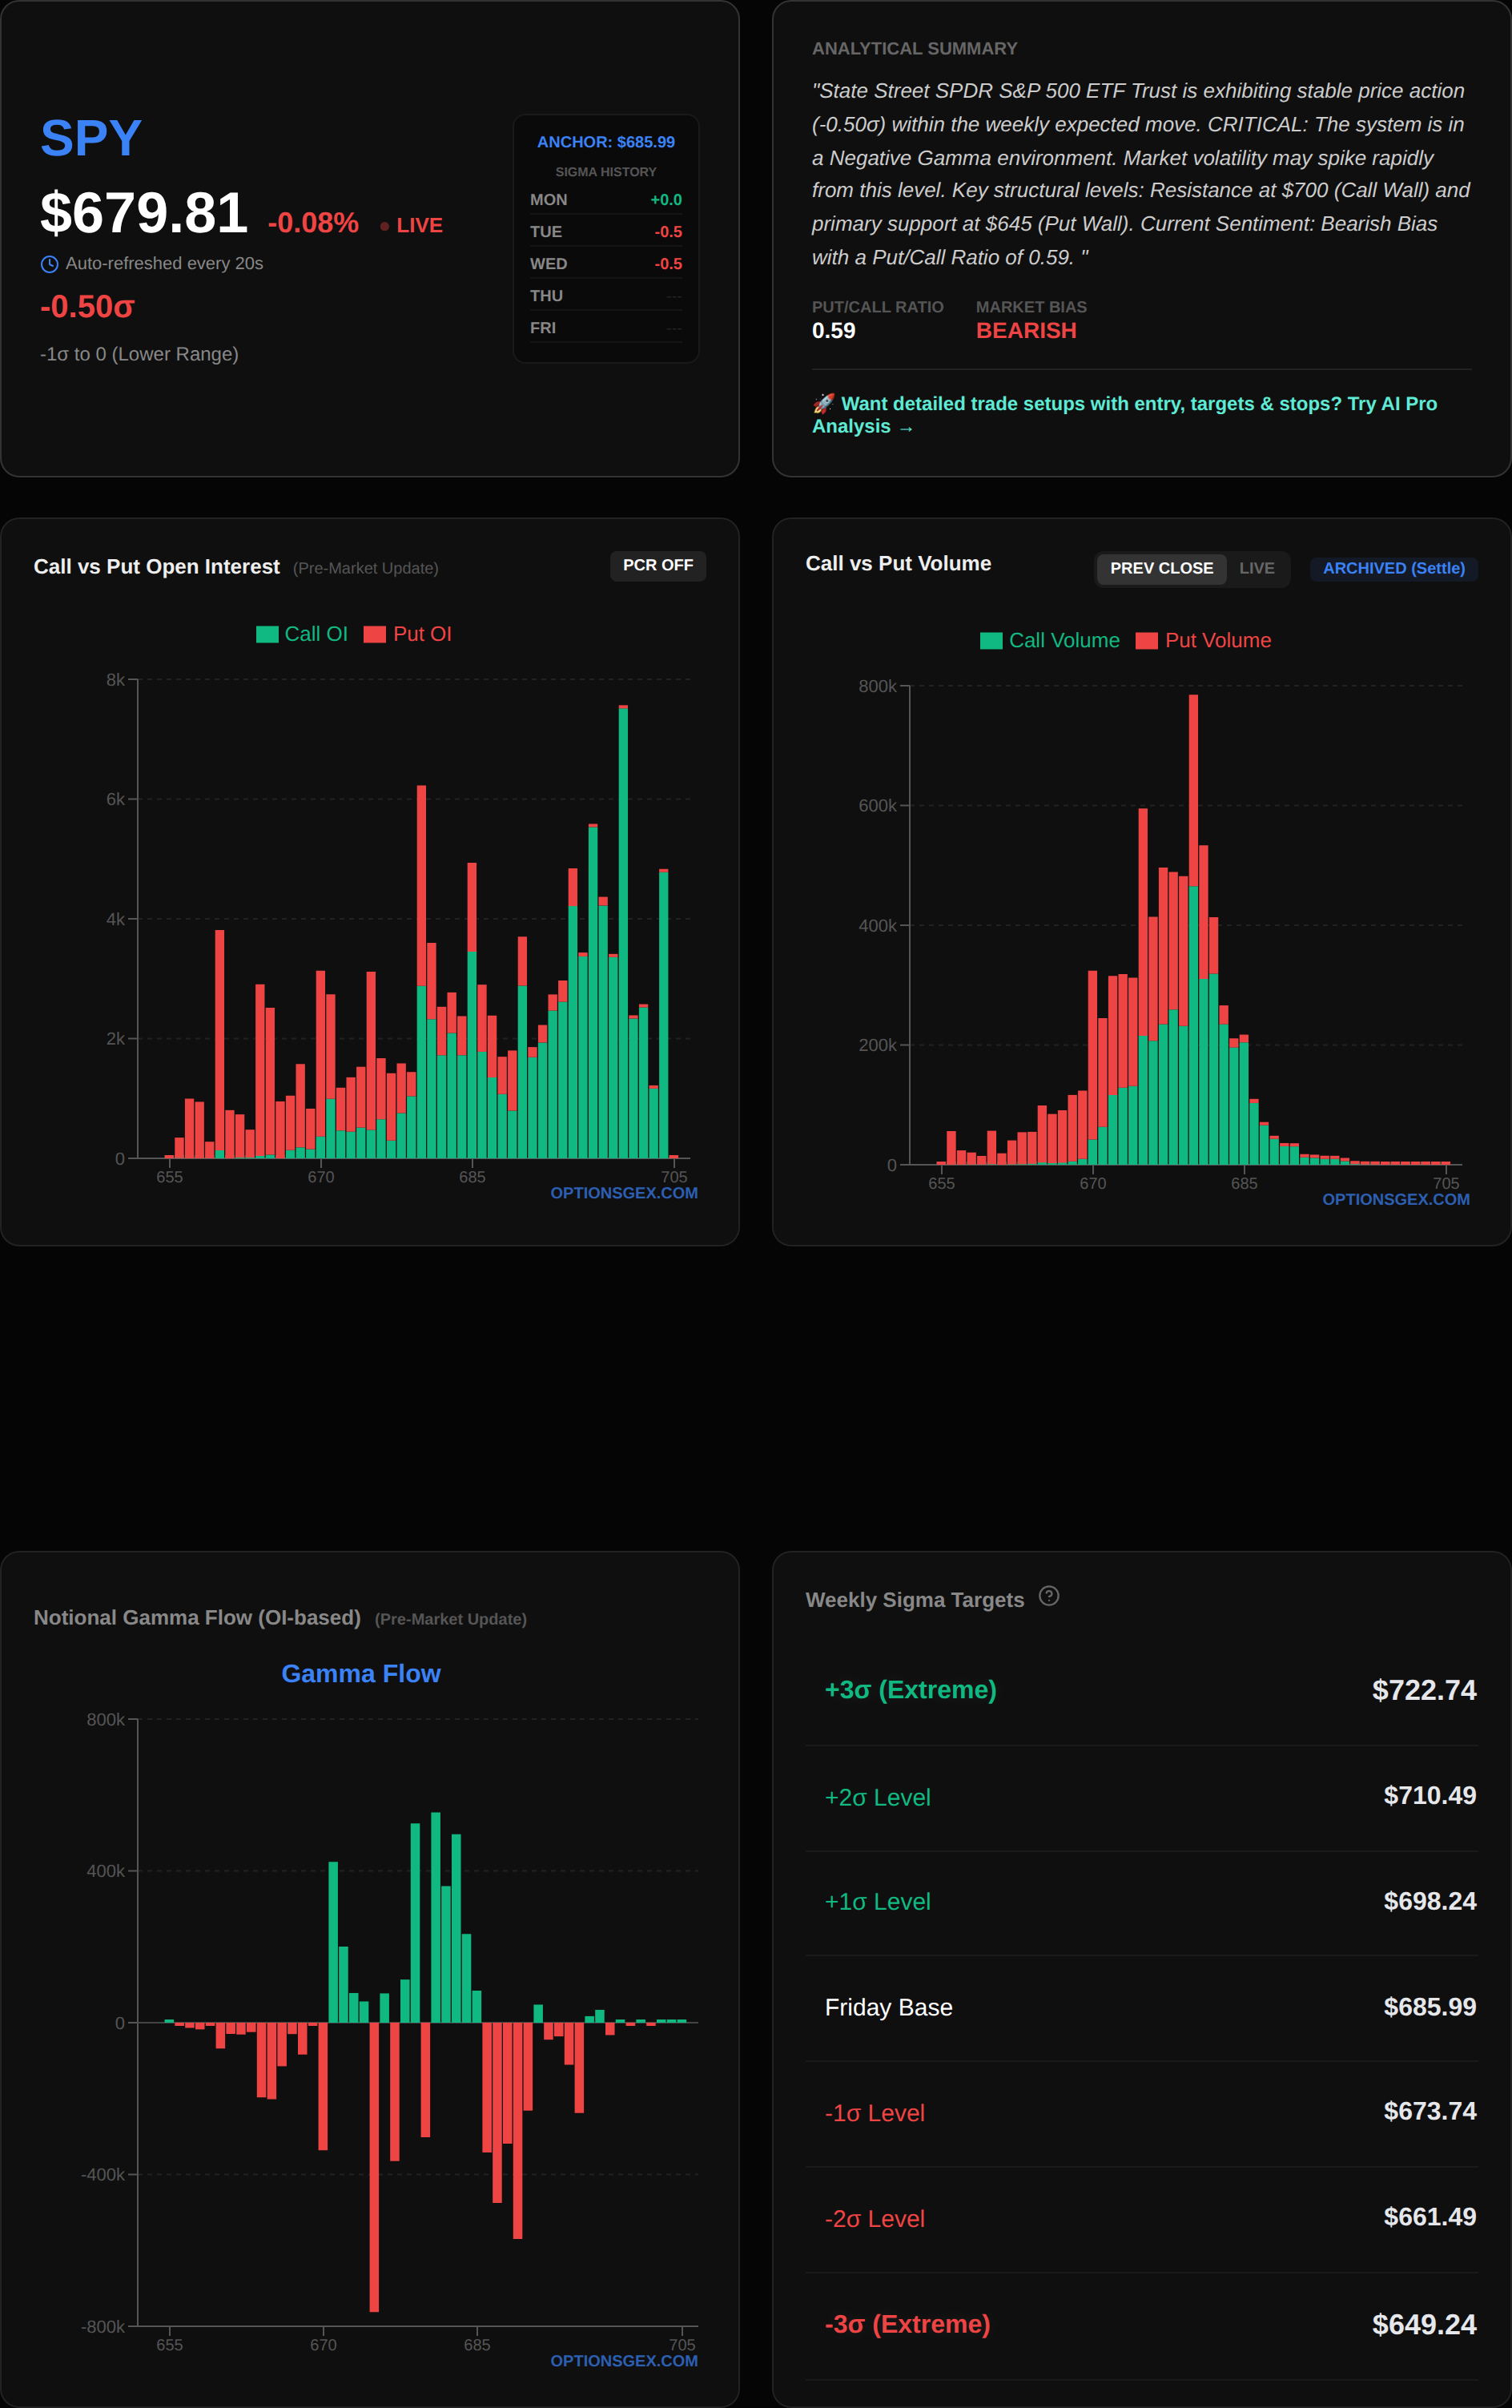
The broader market enters today with a nuanced gamma landscape, suggesting a potential inflection point for volatility. SPY, currently trading at $679.84, sits precisely at its $680.00 Zero Gamma Pivot. This is a critical observation, as a Net GEX of $0.00 Billion for SPY indicates a balanced, albeit fragile, gamma environment. When Net GEX is near zero, the market is highly susceptible to swings in either direction, as dealer hedging flows shift from being stabilizing (positive gamma) to amplifying (negative gamma) or vice-versa with minimal price movement. The absence of a strong positive or negative gamma bias implies that market makers are not significantly long or short gamma across the entire options chain. This can lead to increased volatility and larger price excursions on either side of the pivot.
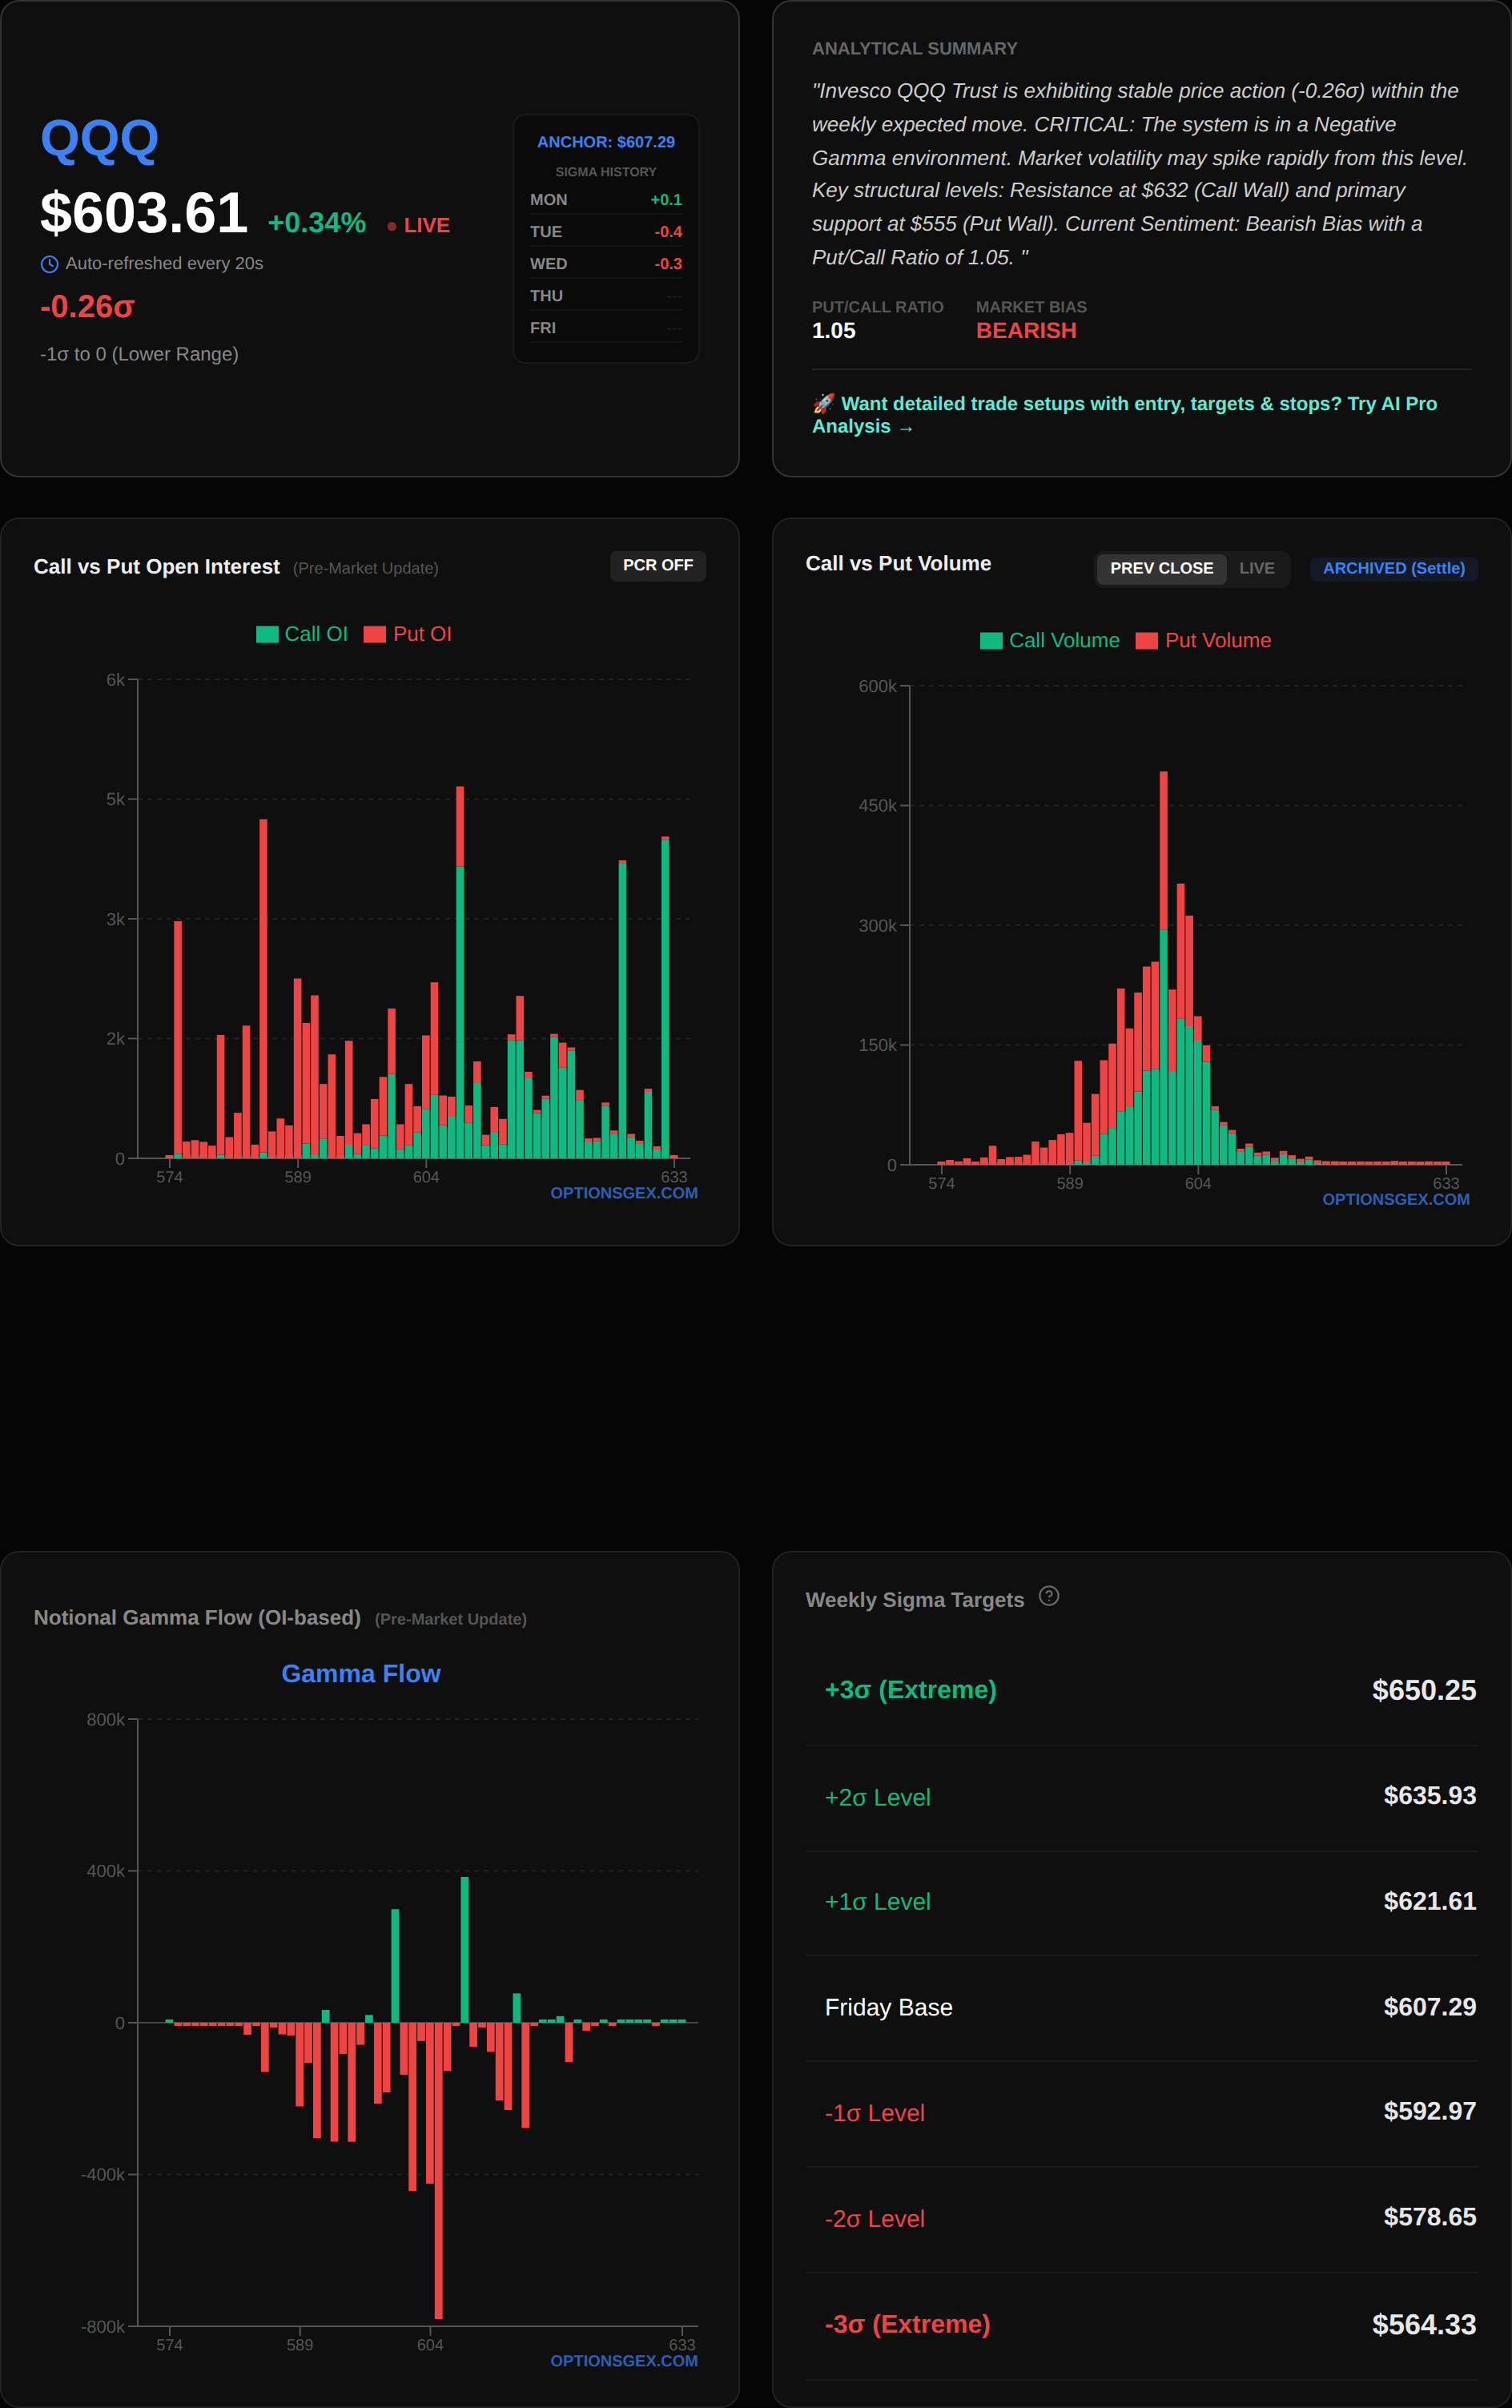
For QQQ, currently at $603.79, the Net GEX is also reported as $-0.00 Billion, but with a starkly different Put/Call Imbalance Ratio of 13,131,250.80. This astronomically high put/call ratio, despite a near-zero Net GEX, suggests a substantial underlying bearish sentiment or heavy hedging activity skewed towards puts. While the Net GEX alone might imply neutrality, the overwhelming put dominance indicates that a significant amount of options exposure is concentrated on the downside. This could be indicative of institutional hedging against long equity positions or outright bearish bets. Such an imbalance, especially around the $601.00 Zero Gamma Pivot, means that any downward pressure could be amplified as dealers are forced to sell into declines to hedge their short put positions, potentially creating a negative feedback loop. The VIX closed at 22.37, elevated from historical lows, which aligns with the potential for increased volatility suggested by the current gamma setup and the put-heavy QQQ positioning. Overall, the market is poised for a potentially volatile session, with both indices hovering around their respective zero-gamma thresholds.
🎯 KEY STRUCTURAL LEVELS
Understanding the precise structural levels is paramount for navigating today's market. These levels represent points where significant options open interest is concentrated, influencing market maker hedging activities and thus shaping price action.
| Index | Spot Price | Major Call Wall | Major Put Wall | Zero Gamma Pivot | Max Pain |
| SPY | $679.84 | $688 | $670 | $680.00 | $679 |
| QQQ | $603.79 | $610 | $570 | $601.00 | $601 |
For SPY, the current spot price of $679.84 is critically positioned just below the $680.00 Zero Gamma Pivot. This level is where the aggregate gamma across all options flips from positive to negative, or vice versa. Below $680.00, dealers are generally short gamma, meaning they must sell into declines and buy into rallies to remain delta-neutral, thereby amplifying price movements. Above $680.00, they are typically long gamma, leading them to buy dips and sell rips, which dampens volatility and keeps price within a tighter range. The $688 Call Wall represents significant resistance, where a large concentration of call options exists. Dealers who are short these calls will aggressively sell futures/equities as price approaches this level to hedge their increasing delta exposure, capping upside. Conversely, the $670 Put Wall provides strong support. Here, dealers are short puts, and as price drops, they will buy futures/equities to hedge, creating a floor. Max Pain at $679 suggests that expiring options would cause the least aggregate loss to options holders if SPY settles at this level.
QQQ at $603.79 is trading above its $601.00 Zero Gamma Pivot. This places QQQ in potentially positive gamma territory, implying a tendency for mean reversion and reduced volatility if it stays above this pivot. However, the extreme put/call imbalance ratio for QQQ cannot be overstated. While above the pivot, the sheer volume of puts indicates a massive amount of downside hedging. The $610 Call Wall acts as a formidable ceiling, similar to SPY, where dealer short call delta hedging will cap rallies. The $570 Put Wall is a distant but robust support level, indicating where significant institutional protection exists. Max Pain for QQQ is also at $601, aligning with its Zero Gamma Pivot, suggesting significant open interest converges at this strike. The interplay between these levels and current price action will dictate daily dynamics, with dealer hedging flows acting as a gravitational pull or a propulsive force.
🔥 UNUSUAL FLOW RADAR: Today's Smart Money Targets
TSLA
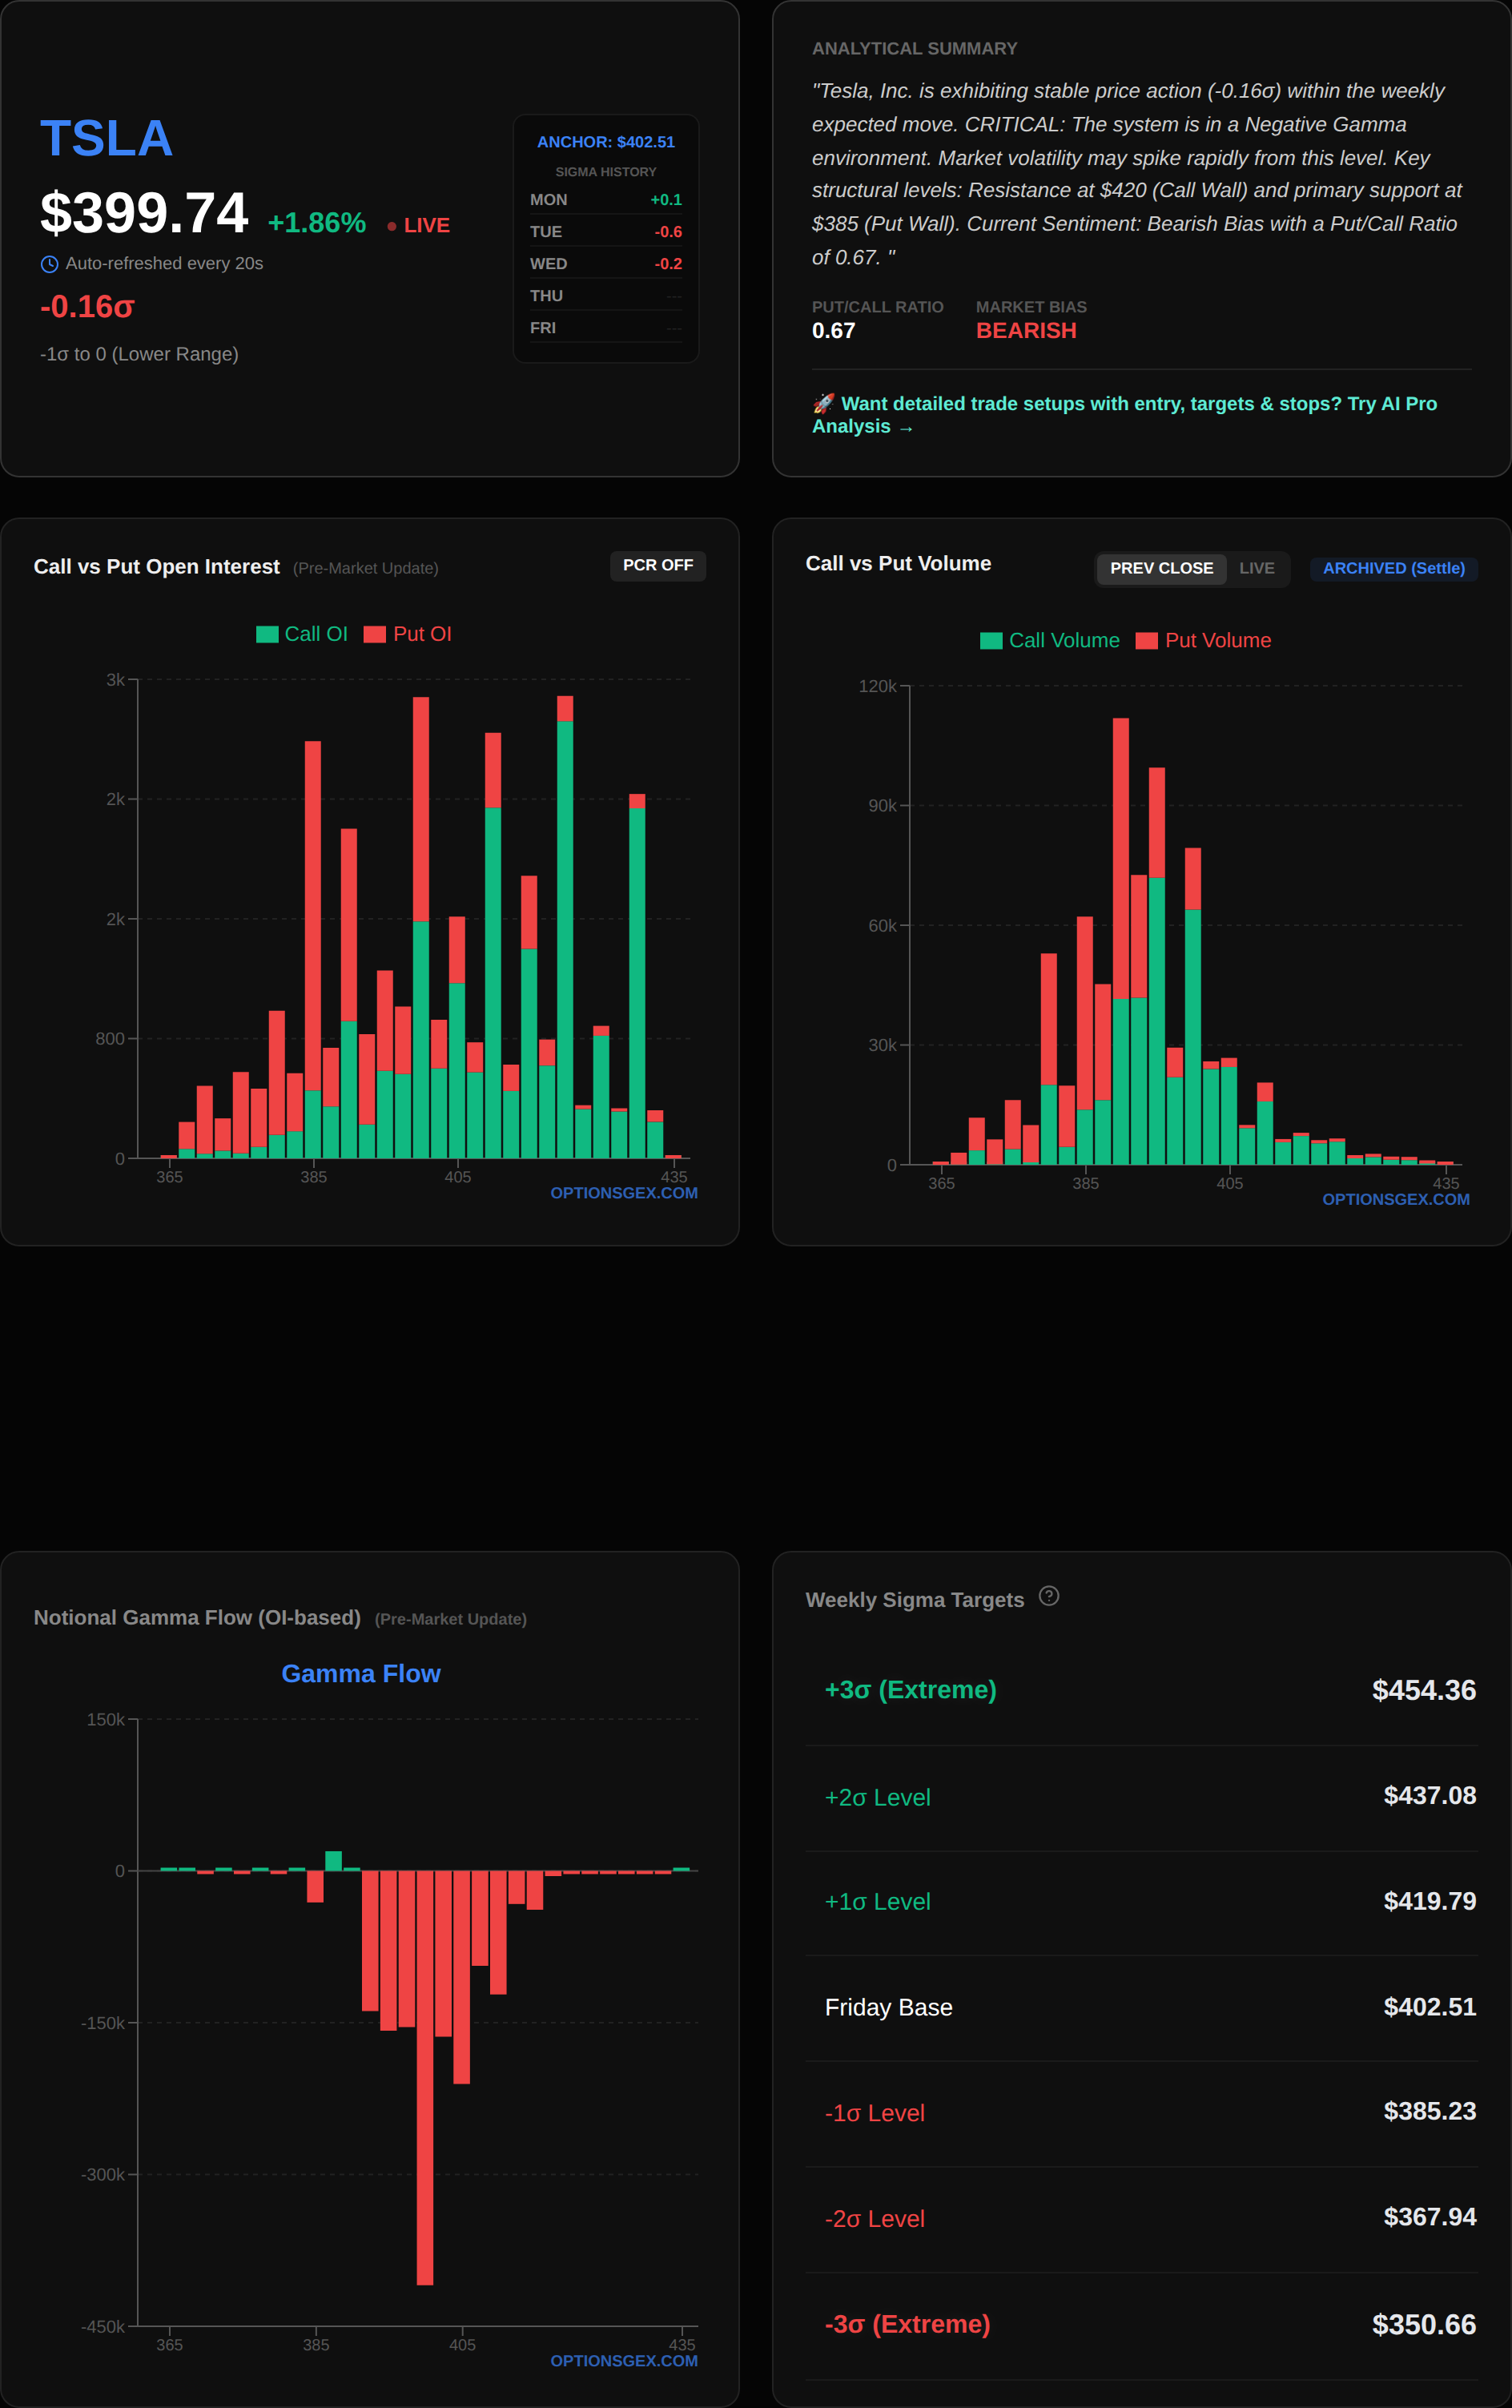
TSLA, currently trading at $399.90, is exhibiting highly unusual put activity, signaling potential downside conviction or significant hedging by smart money. The overall Net GEX for TSLA is $0.00 Billion, with a Call Wall at $400 and a Put Wall at $385. This suggests TSLA is delicately balanced around its $400 psychological and options-based resistance.
The most striking activity is concentrated in three put strikes:
* PUT Strike $392.5: Volume of 30,720 contracts against an Open Interest (OI) of 1,575. This represents an astonishing 19.5x normal volume-to-OI ratio.
* PUT Strike $387.5: Volume of 29,014 contracts against an OI of 2,578. This is 11.3x normal.
* PUT Strike $390: Volume of 70,314 contracts against an OI of 6,625. This is 10.6x normal.
For context, a normal volume-to-OI ratio is typically less than 1.0, and anything above 2.0-3.0 is considered significant. Ratios exceeding 10.0, especially in multiple consecutive strikes, are extremely rare and indicative of a major directional bet or a large institutional hedge being placed. The cluster of these high-volume puts just below the current spot price, specifically around the $387.5 to $392.5 range, suggests that participants are either anticipating a sharp drop or aggressively protecting existing long positions against a move towards the $385 Put Wall. With the Call Wall at $400 acting as immediate resistance, and the spot price just below it, any failure to break above $400 could trigger a cascade of selling pressure, amplified by dealer hedging of these newly opened put positions. The reported Gamma for these strikes is 0.0000, which is likely a data truncation, but the implied volatility (IV) for the $387.5 and $390 puts at 12.5% is notable.
📊 Analyze any ticker yourself: Visit optionsgex.com to view live GEX profiles and Sigma levels for over 500 stocks.
Actionable Trade Idea (Bearish Bias): Consider a Bear Put Spread if TSLA fails to convincingly break and hold above $400.
* Entry Trigger: TSLA trades below $398.00.
* Trade: Buy TSLA PUT $390 (high volume) and sell TSLA PUT $385 (Put Wall).
* Target: A move towards the $385 Put Wall.
* Stop Loss: A close above $402.00.
* Risk Warning: The sheer volume of these puts could also be short-dated hedging against a large long position, which might unwind if TSLA demonstrates unexpected strength.
META
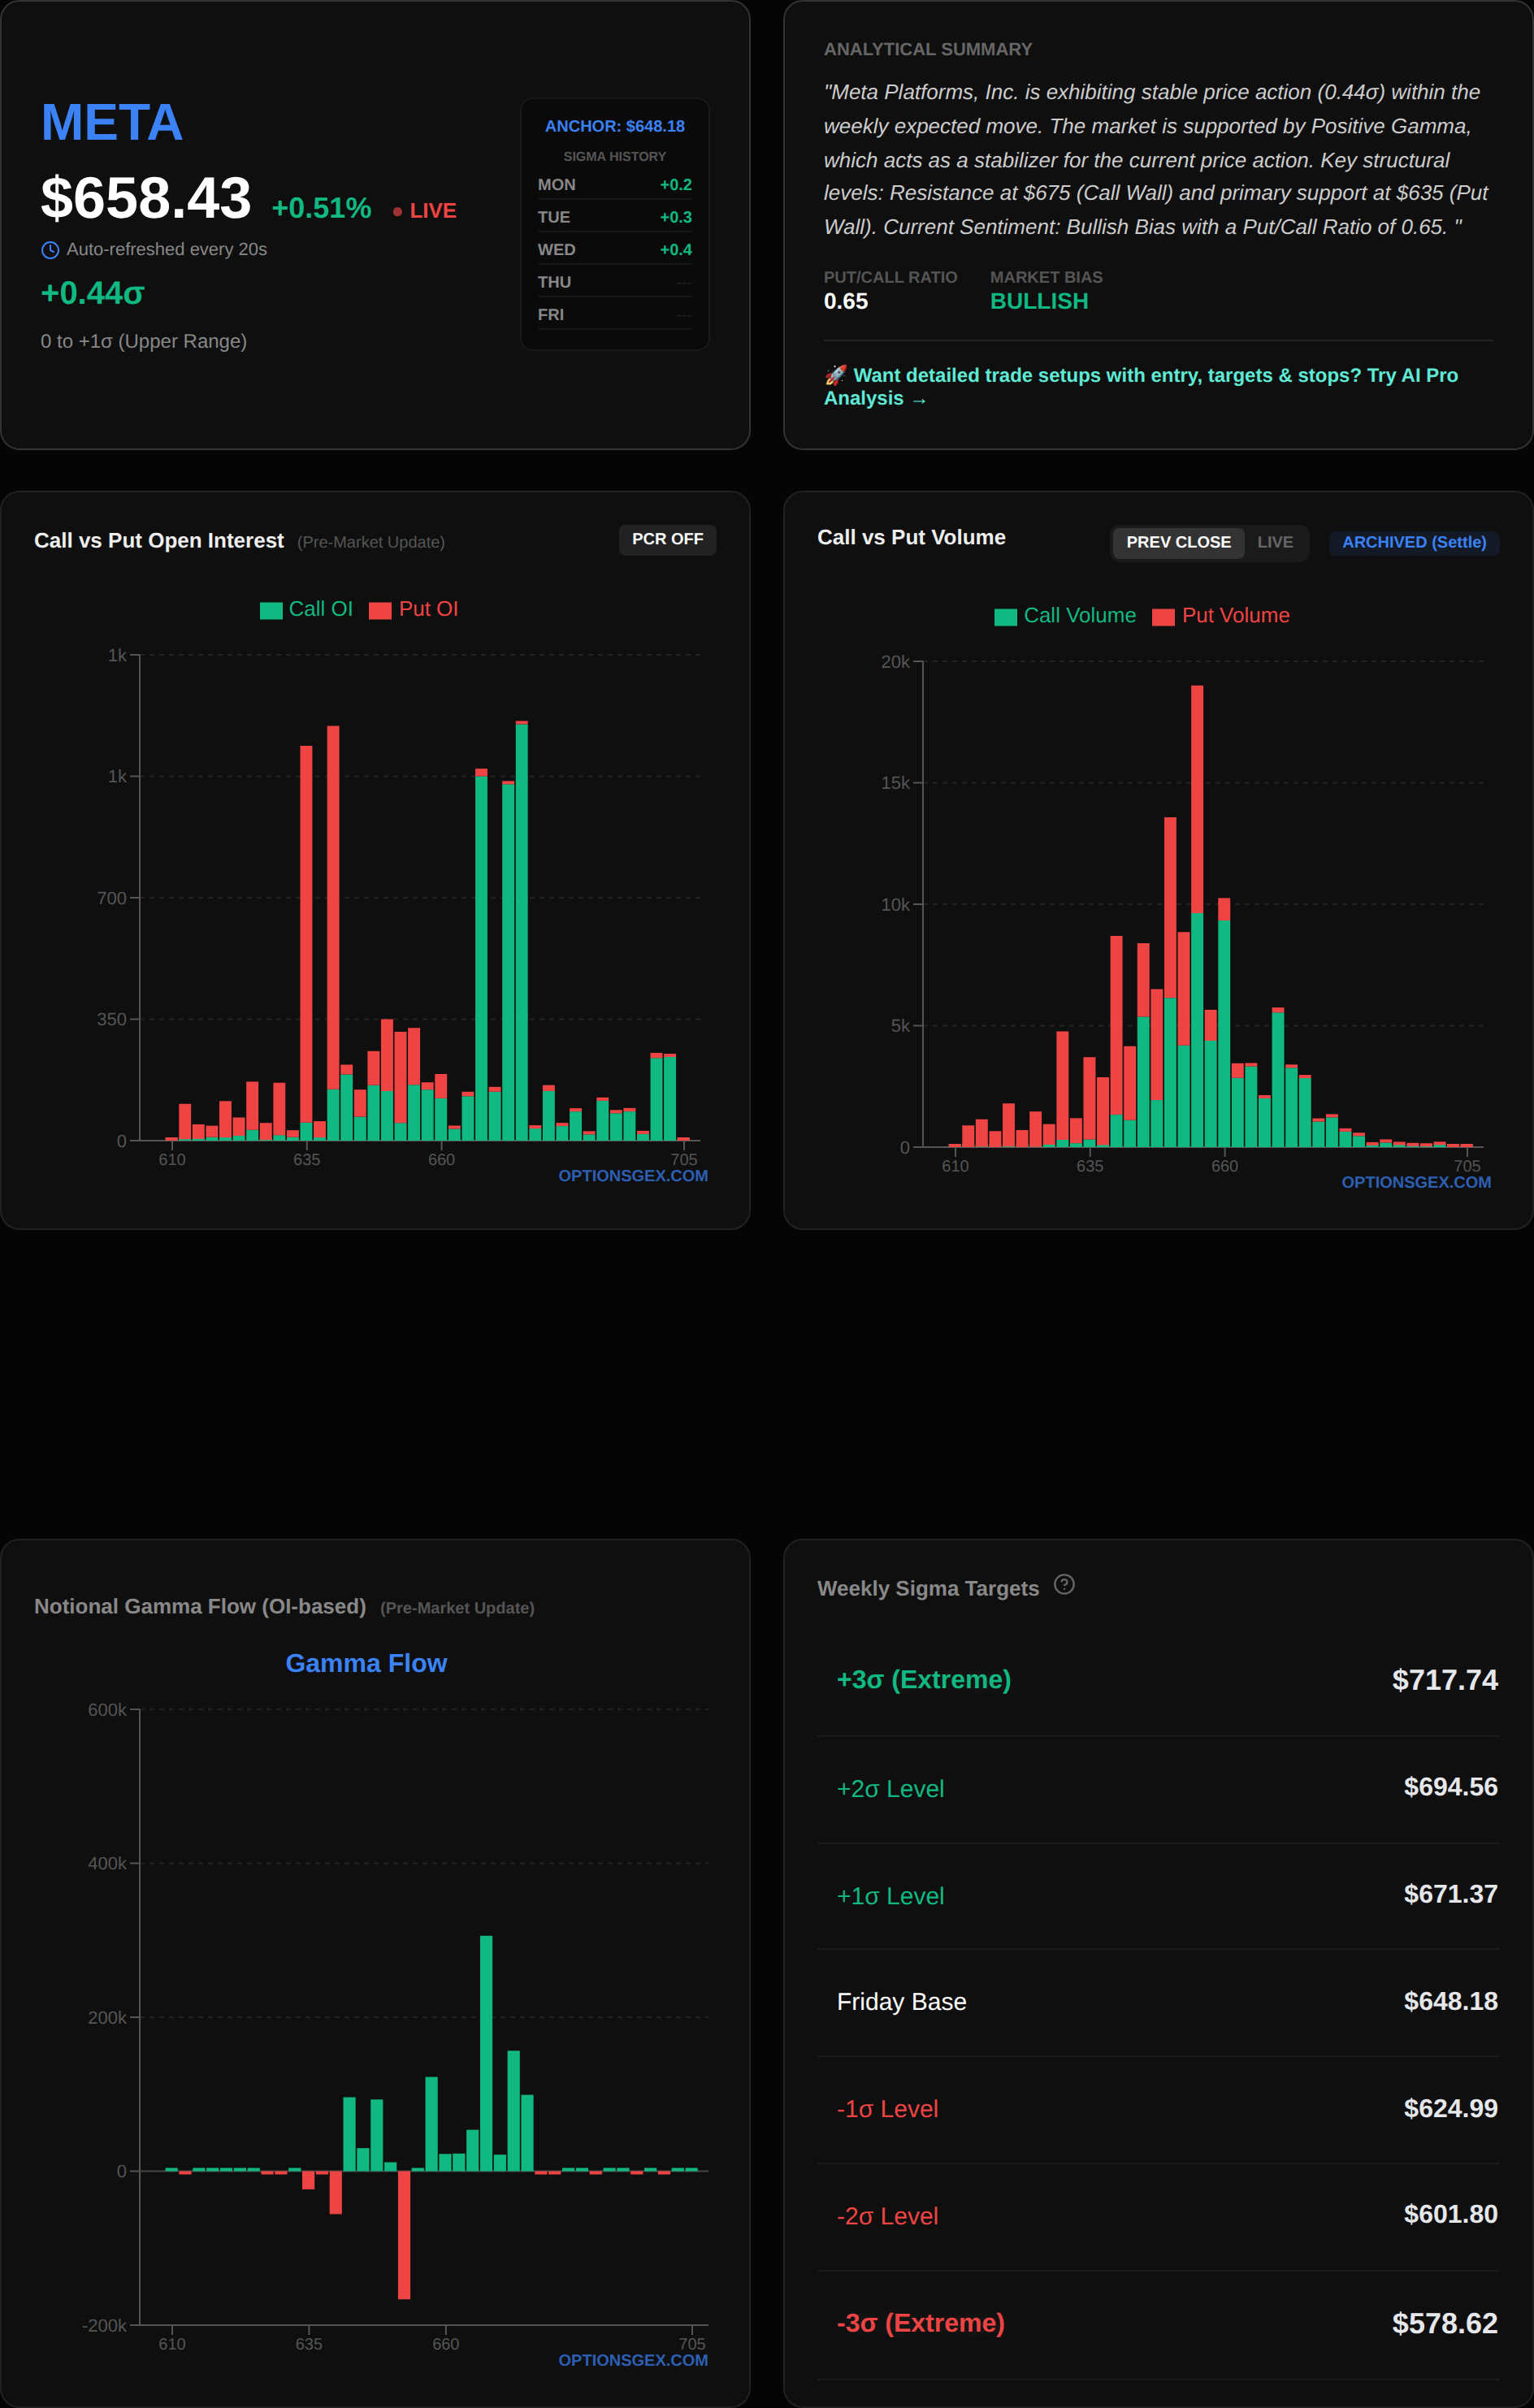
META, currently trading at $659.26, is also showing significant put-side activity, albeit with slightly less extreme volume-to-OI ratios than TSLA, but still highly unusual. The overall Net GEX for META is $0.00 Billion, with a Call Wall at $670 and a Put Wall at $630. This setup implies META is trading in a neutral gamma environment, but the put activity warrants close attention.
The noteworthy put strikes are:
* PUT Strike $655: Volume of 9,374 contracts against an OI of 874. This is 10.7x normal volume.
* PUT Strike $647.5: Volume of 4,571 contracts against an OI of 528. This is 8.7x normal volume.
* PUT Strike $650: Volume of 7,435 contracts against an OI of 961. This is 7.7x normal volume.
These elevated volume-to-OI ratios, particularly for puts clustered just below the current spot price and above the $630 Put Wall, suggest a similar dynamic to TSLA. Large players are positioning for downside, or hedging aggressively. The $655 strike stands out with over 10 times its open interest traded, indicating a strong conviction or a significant new position being initiated. The implied volatility (IV) for these puts ranges from 3.1% to 6.3%, which is relatively low, suggesting these might be part of a larger, more complex strategy or a belief that the downside move, if it occurs, could be sharp. The $670 Call Wall represents immediate resistance, implying limited upside before encountering dealer selling pressure.
Detailed Risk Warning: While the put activity is substantial, META's overall gamma environment is neutral. This means that while downside momentum could be amplified if $655 breaks, there isn't an inherent negative gamma predisposition to accelerate the move without a fundamental catalyst. The $630 Put Wall is a robust support level that could halt any significant decline. Traders should be cautious of chasing a move lower unless a clear break of the $655 level occurs on significant volume, as the current flows could also be part of a short-term hedge that may expire worthless. Monitor price action around $655 closely.
⚠️ TRADING SCENARIOS
Today's market, with SPY at its Zero Gamma Pivot and QQQ exhibiting a massive put imbalance, presents several distinct trading scenarios.
🟢 Bullish Case:
A bullish scenario for SPY hinges on a decisive break and hold above the $680.00 Zero Gamma Pivot. If SPY can sustain trade above $680.00, dealer hedging will likely shift into a long gamma posture, meaning they will buy dips and sell rallies. This would create a stabilizing effect, dampening volatility and potentially allowing SPY to grind higher towards the $688 Call Wall. A confirmed break above $680.00 on increased volume, especially if accompanied by a positive shift in overall Net GEX, would be the trigger for long positions. QQQ would need to follow suit, ideally reclaiming its $601.00 Zero Gamma Pivot and showing signs of put unwinding. Target for SPY would be $685.00 - $688.00.
🔴 Bearish Case:
The bearish case is activated if SPY fails to hold $680.00 and definitively breaks below it, particularly if it drops below $679 (Max Pain). Below $680.00, dealers become short gamma, forcing them to sell into declines and buy into rallies, thereby accelerating downward momentum. This scenario is further exacerbated by the massive put imbalance in QQQ, which could lead to aggressive selling by dealers hedging their short put positions if QQQ breaks below $601.00. The unusual put activity in TSLA and META also points to potential downside pressure in mega-cap tech. A sustained break below $679.00 for SPY would open the path towards the $670 Put Wall. For QQQ, a break below $601.00 could see it test $595.00, with the $570 Put Wall as a longer-term target.
🟡 Choppy/Range-Bound Case:
The most likely scenario for SPY, given its current position exactly at the Zero Gamma Pivot and a Net GEX of $0.00 Billion, is a choppy, range-bound day if it fails to develop strong directional conviction. If SPY oscillates around the $680.00 level without a clear break above or below, dealer hedging will be balanced, leading to whipsaw action. The range for SPY would likely be between $678.00 and $682.00, with frequent tests of $680.00. QQQ could see a similar range around $601.00 - $605.00, despite its put imbalance, if the broader market lacks directional impetus. This scenario implies that the Call Wall at $688 and Put Wall at $670 for SPY (and $610 / $570 for QQQ) will remain unchallenged, with price action contained within tighter boundaries dictated by short-term gamma flows.


Comments
Post a Comment