SPY: The $691.00 Zero Gamma Pivot Decides Everything Today
SPY: The $691.00 Zero Gamma Pivot Decides Everything Today
📊 MARKET OVERVIEW
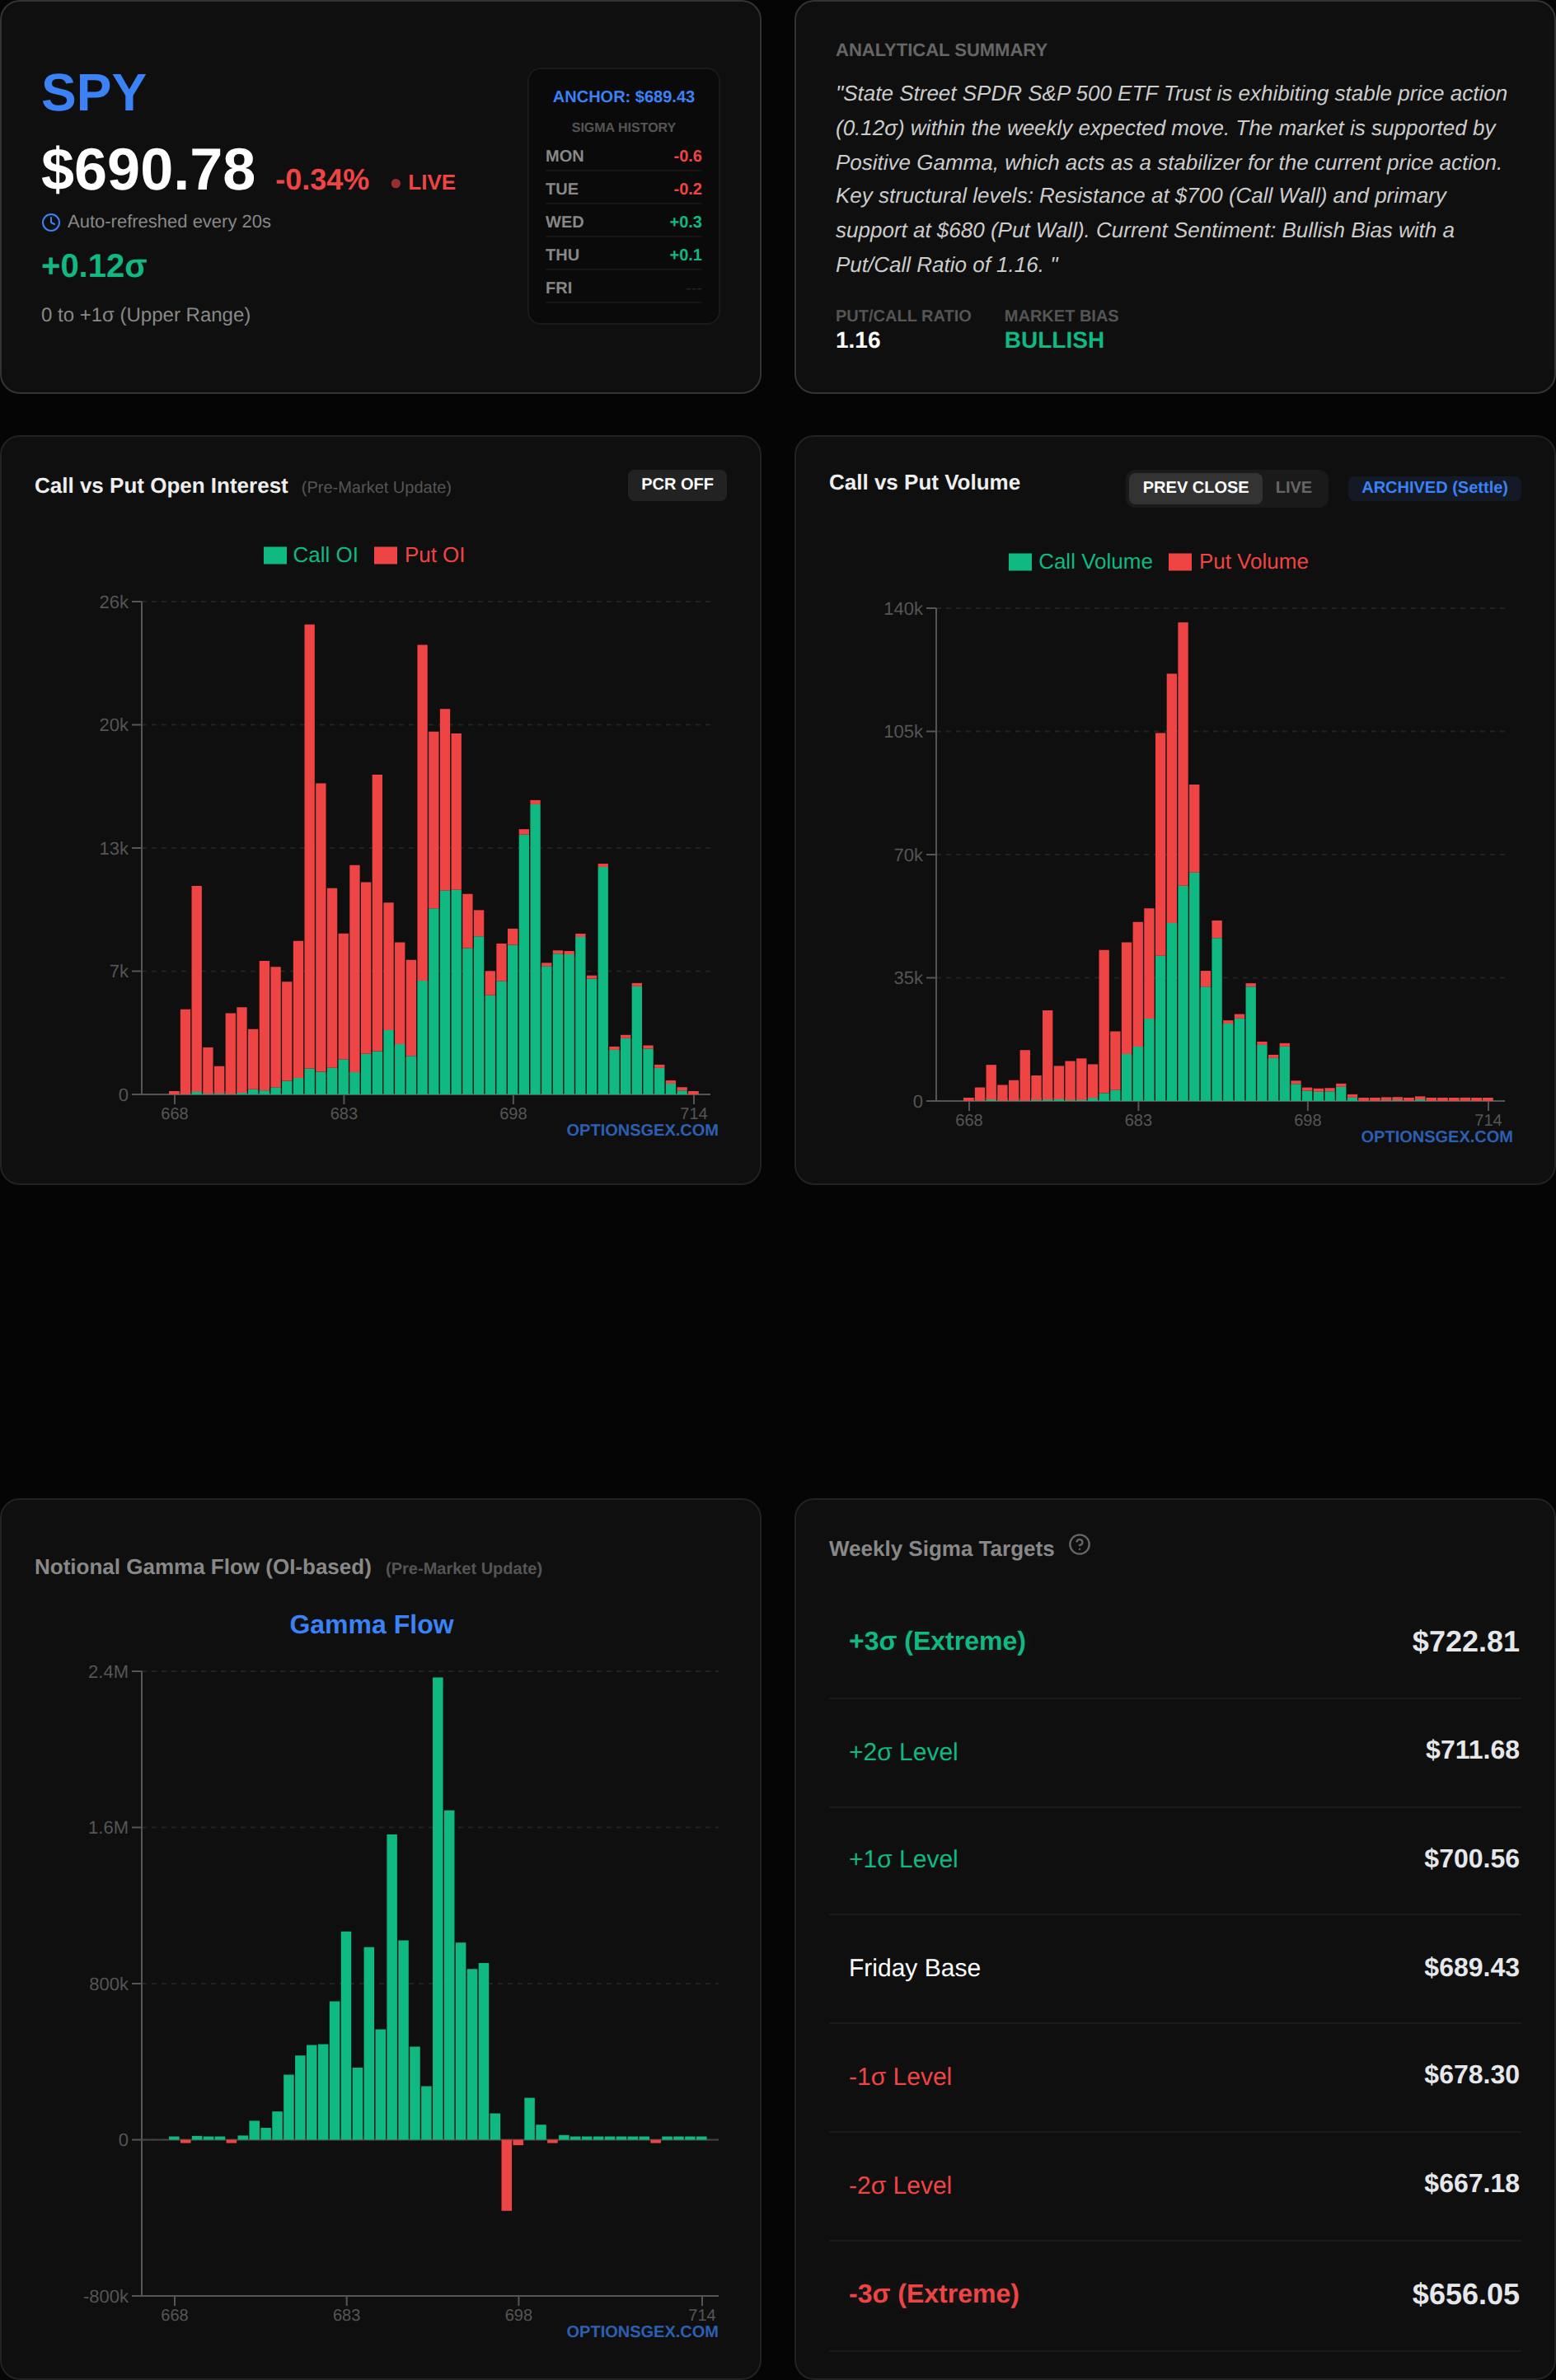
The options market opens today with a nuanced picture, particularly across the core indices SPY and QQQ. SPY currently sits at $690.80, hovering precariously close to its Zero Gamma Pivot. Critically, SPY's Net GEX is reported at $0.00 Billion, indicating a finely balanced gamma environment. This specific reading suggests that market makers are not significantly long or short gamma overall for SPY, which can lead to increased sensitivity around key price levels. In such a neutral gamma state, any significant directional move could quickly force dealers to re-hedge, potentially amplifying volatility. The Put/Call Imbalance Ratio for SPY is also 0.00, reinforcing this equilibrium and suggesting no immediate bias from a volume perspective.
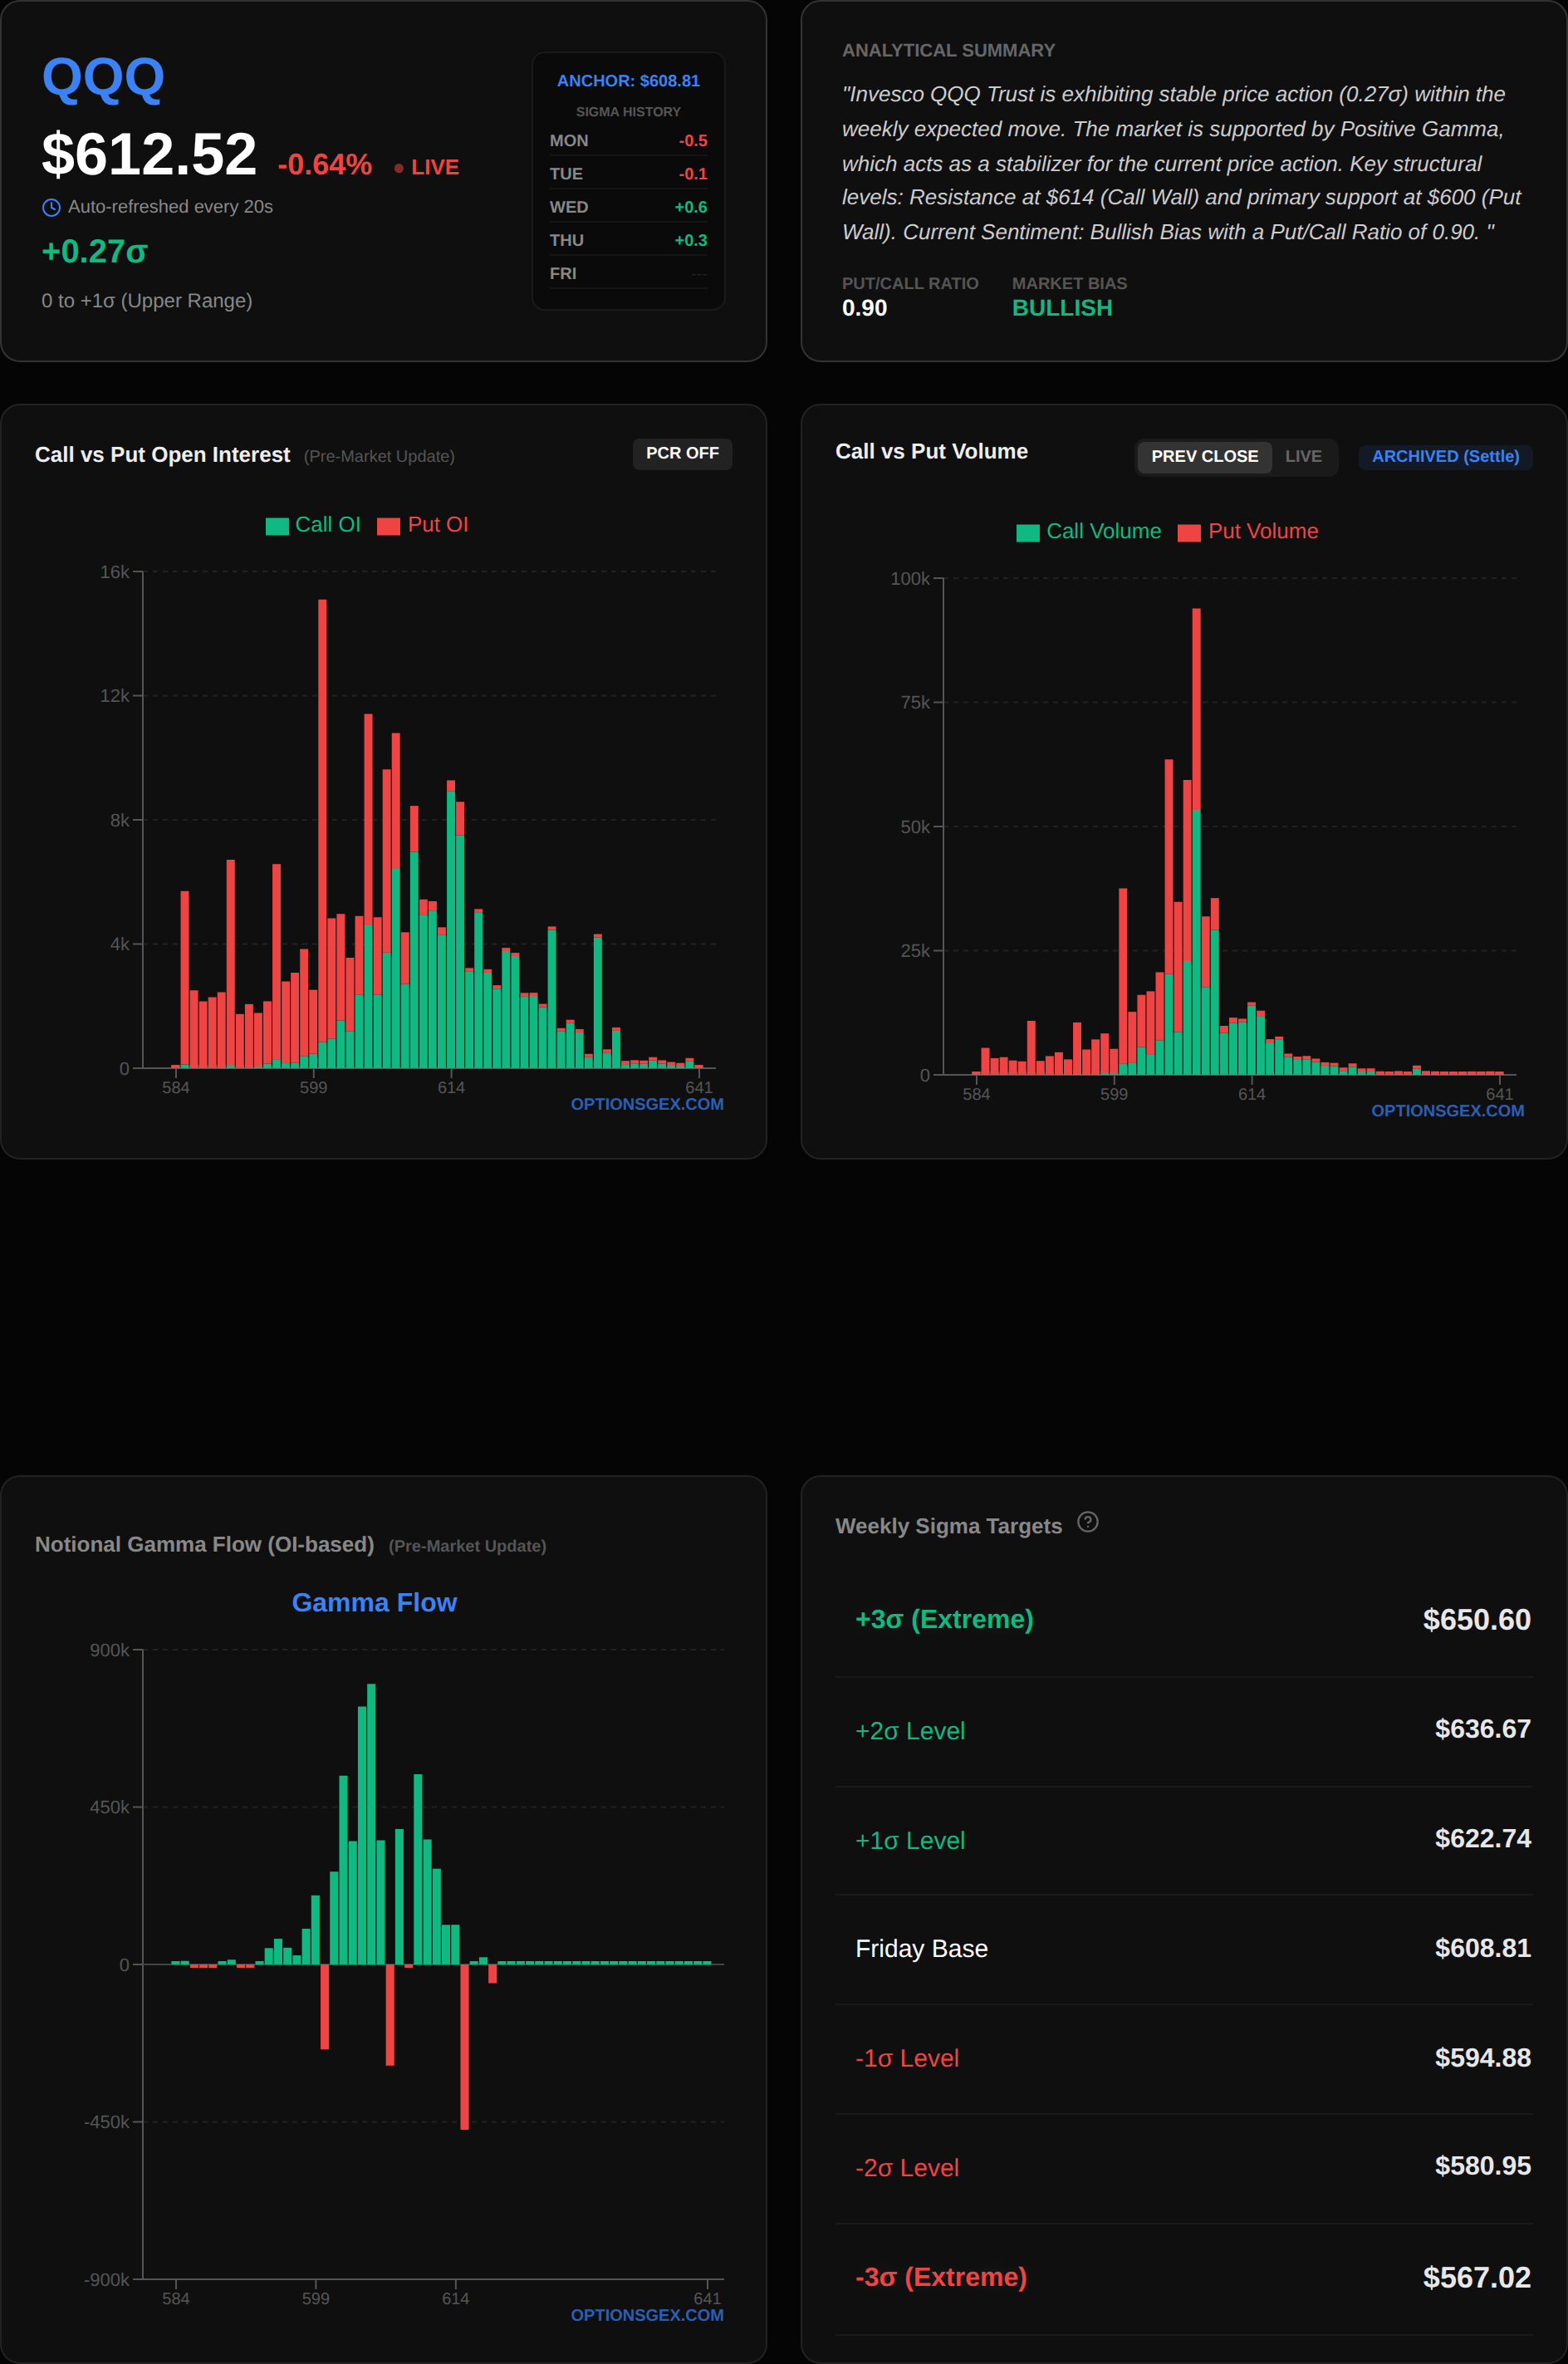
Conversely, QQQ, currently at $612.65, presents a slightly different gamma profile. Its Net GEX is $-0.00 Billion, which, while numerically similar to SPY's, the negative sign implies a leaning towards negative gamma. This is further supported by a substantial Put/Call Imbalance Ratio of 120.21, indicating a significant skew towards put options. A negative gamma environment, particularly around the Zero Gamma Pivot of $612.02, means that as QQQ moves, market makers will be forced to sell into strength and buy into weakness to maintain a delta-neutral position. This dynamic tends to exacerbate price swings, leading to higher volatility and potentially sharper moves in the direction of the initial impulse. The VIX, closing at 17.92, remains at a moderate level, suggesting that while significant volatility is not priced in, the structural gamma dynamics in QQQ could lead to localized spikes if key levels are breached. Overall, SPY's neutrality suggests a "wait and see" approach, while QQQ's negative gamma implies readiness for potential momentum plays, especially if its Zero Gamma is violated.
🎯 KEY STRUCTURAL LEVELS
Understanding the precise structural levels for SPY and QQQ is paramount for navigating today's market. These levels represent points where market maker hedging activity is concentrated, acting as significant gravitational forces or inflection points for price action.
| Index | Spot Price | Call Wall (Resistance) | Put Wall (Support) | Zero Gamma Pivot (Vol Expansion) | Max Pain |
| SPY | $690.80 | $700 | $680 | $691.00 | $691 |
| QQQ | $612.65 | $625 | $555 | $612.02 | $614 |
For SPY, the $700 Call Wall represents a formidable resistance level. Market makers holding short call positions at this strike will be aggressively selling futures or underlying shares as SPY approaches this level to hedge their delta. Conversely, the $680 Put Wall acts as robust support, where dealers long put options will be buying futures or shares to maintain neutrality. The most critical level for SPY today is the $691.00 Zero Gamma Pivot. With SPY currently at $690.80, just below this pivot, we are teetering on the edge of a significant shift. Above $691.00, SPY would enter positive gamma territory, implying market makers would buy dips and sell rallies, leading to reduced volatility and potential mean reversion. Below $691.00, SPY remains in negative gamma, where market makers would sell into weakness and buy into strength, accelerating momentum. The Max Pain of $691 further reinforces this area as a magnet for price, where the maximum number of options expire worthless.
For QQQ, the $625 Call Wall is a significant overhead resistance. Market makers with short call exposure here will exert downward pressure as QQQ attempts to break higher. The $555 Put Wall is a substantial support level, indicating a deep floor where significant buying interest from dealers is expected. The Zero Gamma Pivot for QQQ is at $612.02. With QQQ currently at $612.65, it is trading just above this pivot, but within a negative gamma environment. This suggests that any move away from this pivot could be amplified by dealer hedging. If QQQ decisively breaks below $612.02, expect accelerated downside momentum as market makers sell into the decline. The Max Pain for QQQ is $614, suggesting that the market has a gravitational pull towards this level by expiration. The wide range between QQQ's Call and Put Walls, particularly the deep Put Wall, indicates a market structured for potential volatility if key levels are breached.
🔥 UNUSUAL FLOW RADAR: Today's Smart Money Targets
META - Unusual Flow Alert
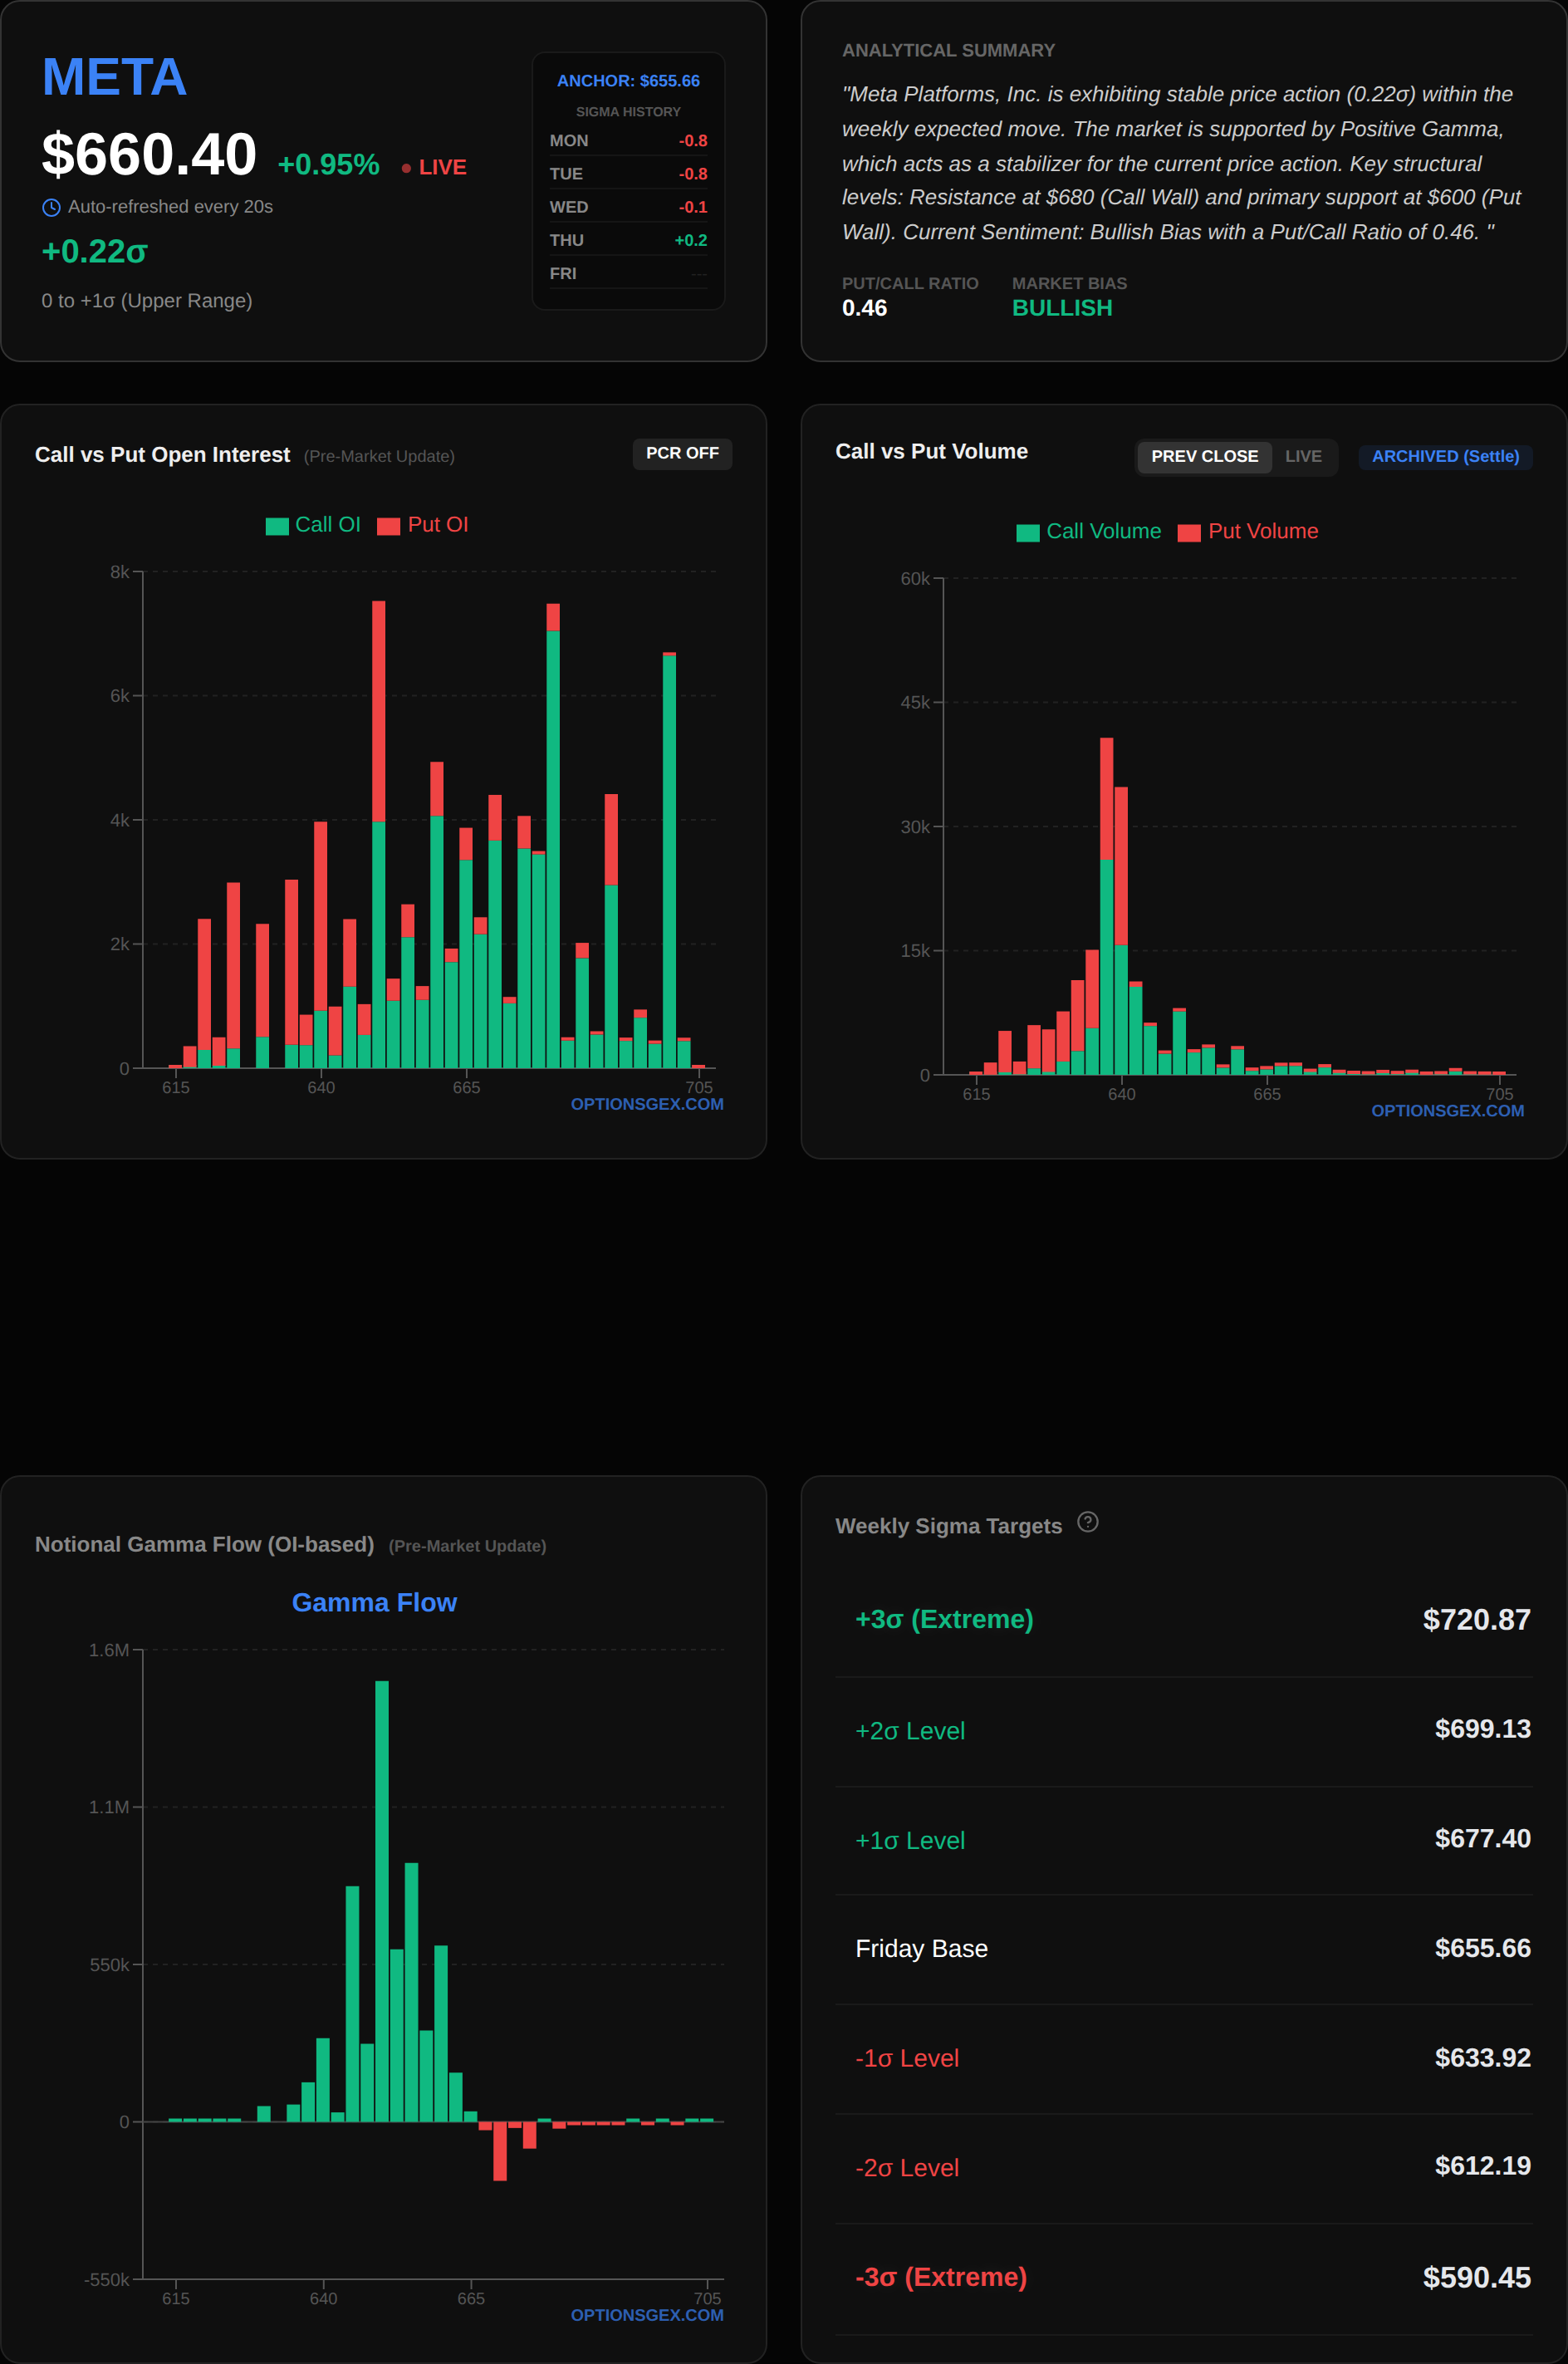
META, currently trading at $659.47, is flashing significant unusual put option activity, suggesting a potential bearish sentiment or hedging against downside risk. The overall Net GEX for META is $0.03 Billion, indicating a marginally positive gamma environment, implying some mean-reversion tendencies. However, the specific put flows demand attention. The $647.5 strike saw a staggering 3492 contracts traded against an Open Interest (OI) of 496, resulting in a 7.0x volume-to-OI ratio. Normal volume-to-OI is typically below 1.0x, so this ratio is exceptionally high, signaling new, aggressive positioning. Similarly, the $655 strike recorded 1972 contracts against 529 OI (3.7x normal), and the $657.5 strike had 653 contracts against 223 OI (2.9x normal). All these strikes are out-of-the-money (OTM) puts, with relatively low implied volatilities (IVs) ranging from 0.8% to 6.3%.
This clustered put activity, particularly far OTM, often indicates institutional hedging against a long equity position or a speculative bearish bet expecting a swift downside move. Given META's overall positive gamma environment (Call Wall at $680, Put Wall at $600), a move towards the $647.5 put strike could trigger dealer selling if these puts are bought to open. The Gamma values for these puts are extremely low (near 0.0000), meaning their delta changes slowly, but the sheer volume suggests a significant capital allocation.
Actionable Risk Warning: The high volume in OTM puts, especially at $647.5, suggests a significant short-term downside concern. If META breaks below $655, expect accelerated selling pressure as market makers are forced to sell the underlying to hedge their short put positions. Traders holding long META positions should consider tightening stop-losses or initiating protective put spreads with the $657.5/$655 strikes as a hedge against a potential sharp decline. A break below $647.5 would indicate a strong conviction move towards the $600 Put Wall.
TSLA - Unusual Flow Alert
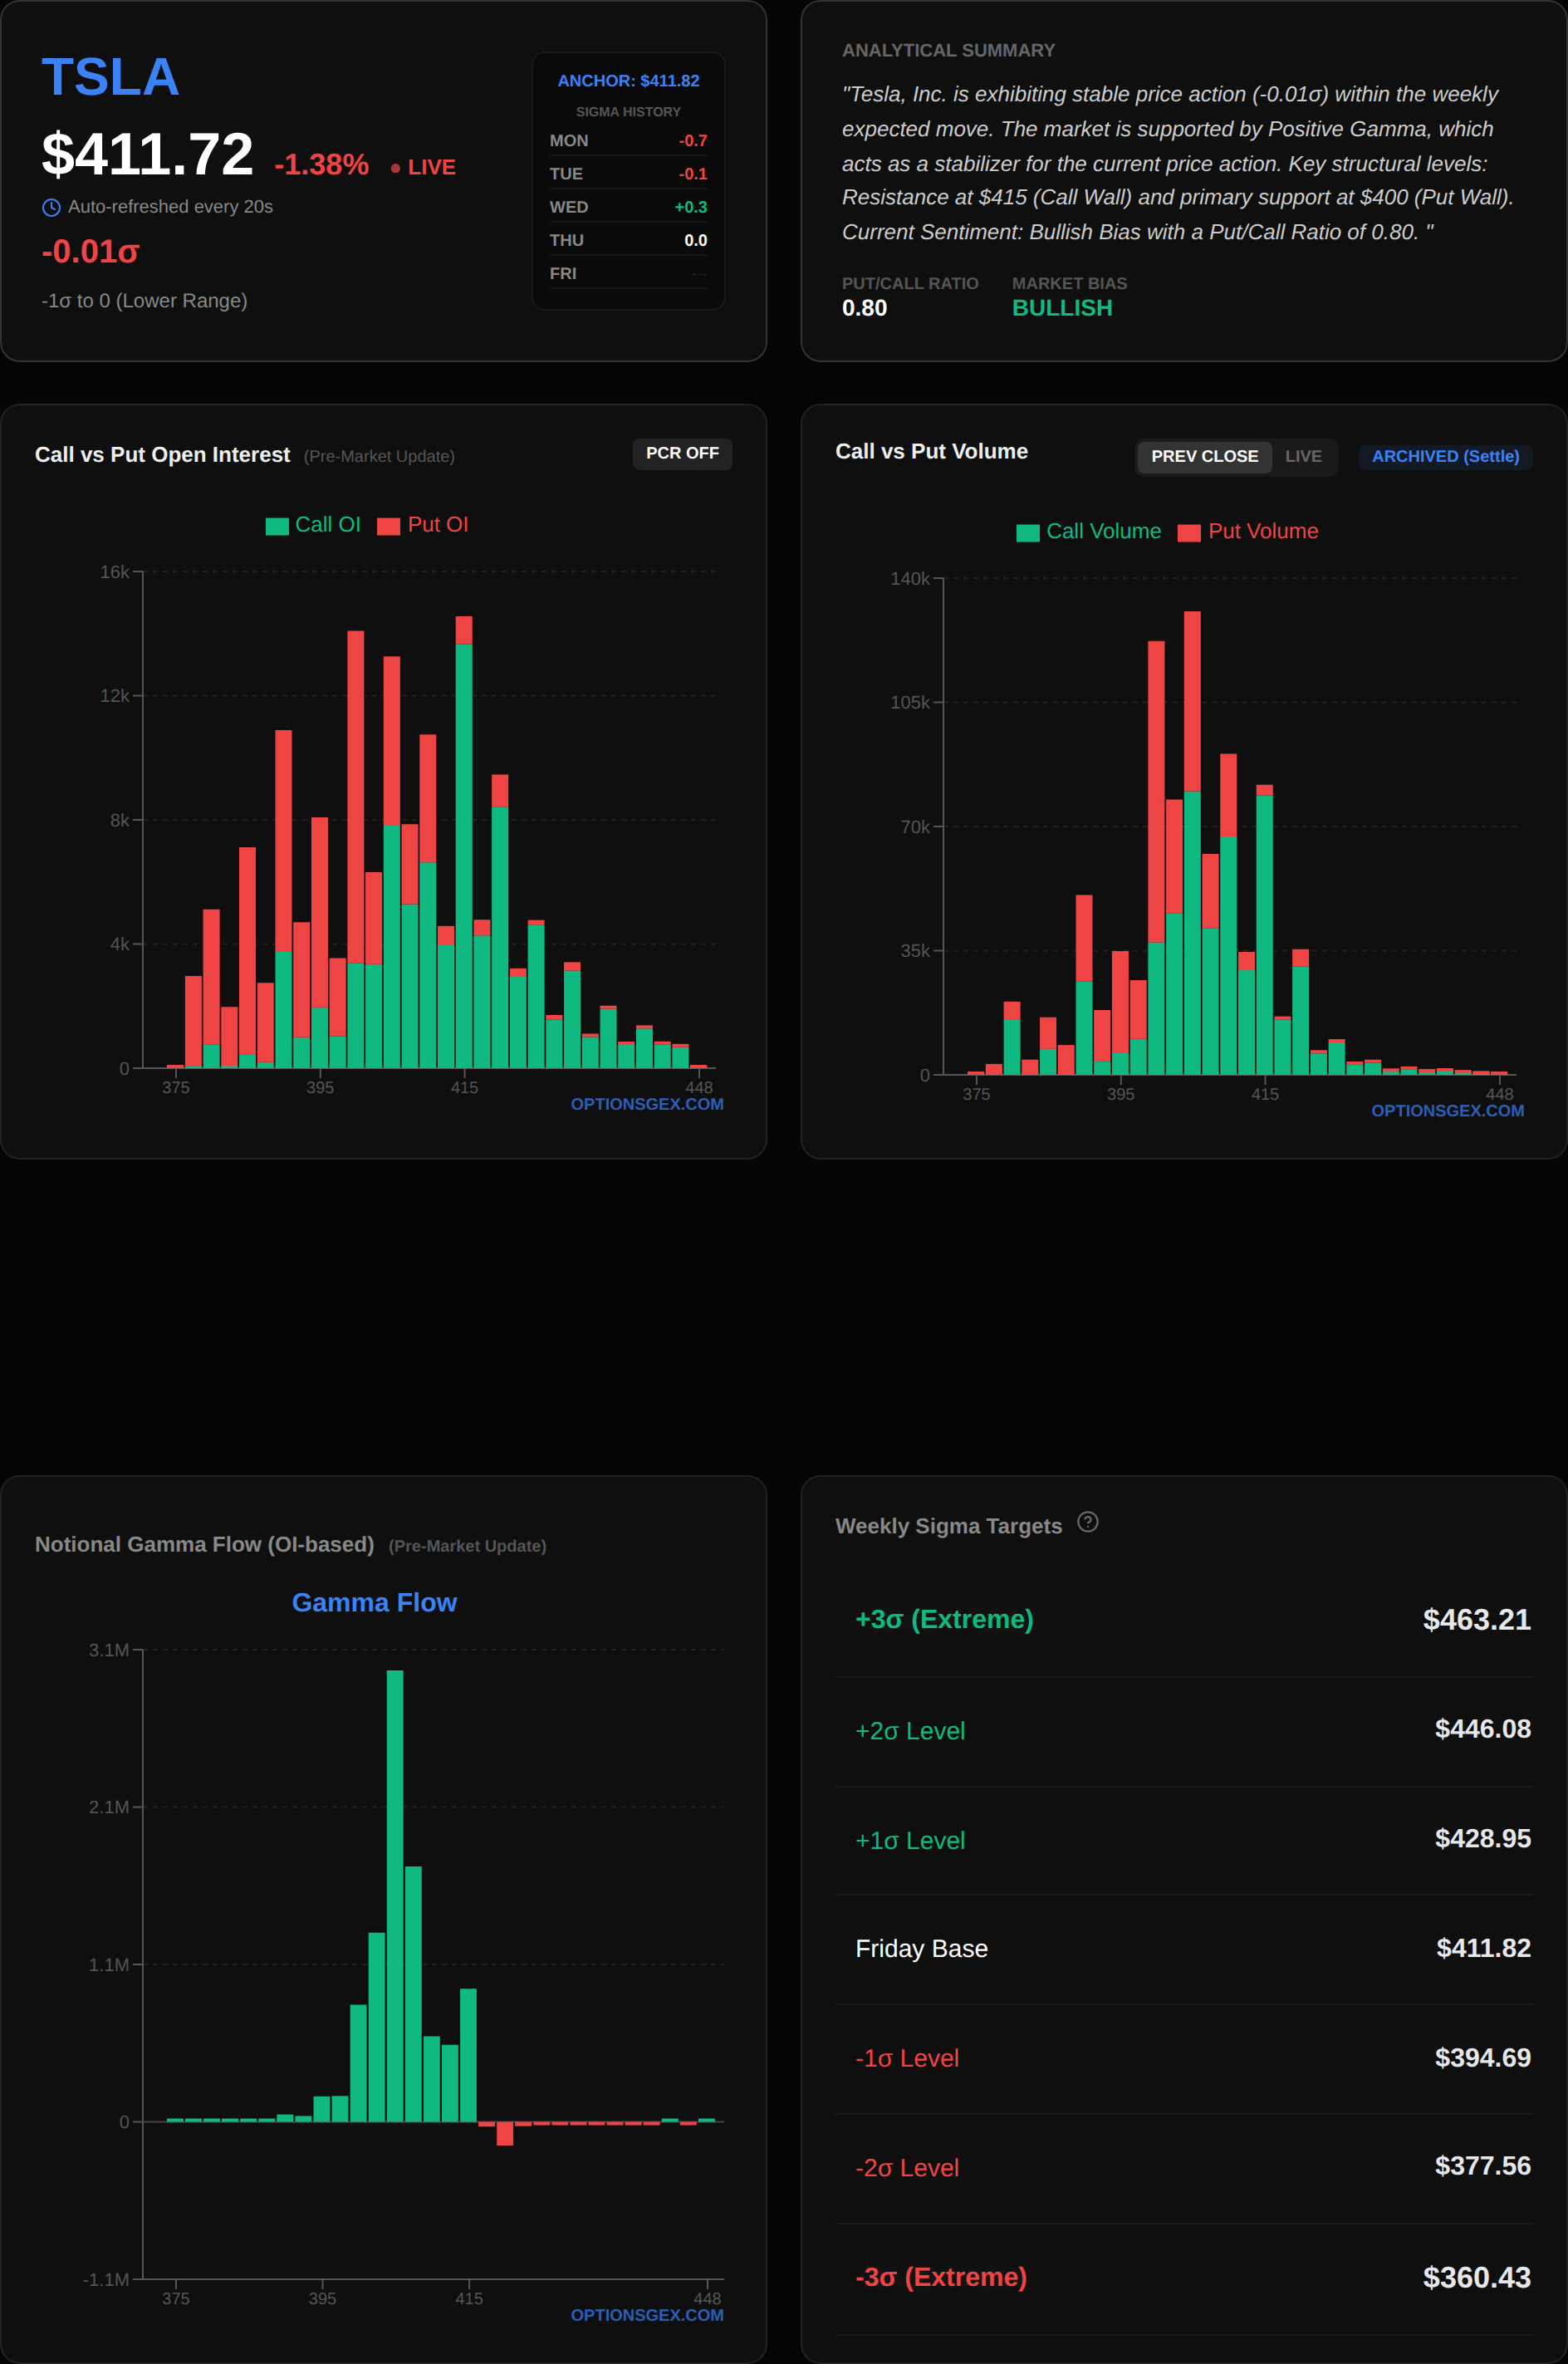
TSLA, currently trading at $411.81, is exhibiting significant unusual call and put activity, indicating a battle between bullish and bearish sentiment. The overall Net GEX for TSLA is $0.00 Billion, suggesting a neutral gamma environment similar to SPY, implying that price action could be highly sensitive to directional triggers.
On the bullish side, there's massive call volume. The $417.5 call strike saw 26781 contracts traded against an OI of 5033 (5.3x normal), and the $415 call strike recorded an even higher 38510 contracts against 7347 OI (5.2x normal). These are both OTM calls, with IVs of 6.3% and 3.1% respectively, suggesting aggressive speculative buying or bullish hedging. Such high volume-to-OI ratios in OTM calls typically indicate expectations of a rapid upside move.
However, there's also notable put activity. The $407.5 put strike saw 7123 contracts traded against an OI of 1972 (3.6x normal). This OTM put flow suggests some participants are either hedging against a long position or betting on a downside move. The gamma values for all these flagged strikes are very low (near 0.0000 or 0.0001), indicating they are far from the money and their delta sensitivity is minimal unless a significant move occurs.
Actionable Trade Idea: TSLA is poised for a volatile move, likely triggered by a break above $415 or below $407.5.
* Bullish Scenario: If TSLA decisively breaks and holds above $415, the immense call volume suggests a potential squeeze towards the Call Wall at $660. Consider a long position targeting $417.5 as the first resistance, with a stop-loss just below $414. Aggressive traders could consider a short-term call option with a $417.5 strike.
* Bearish Scenario: If TSLA fails to hold $410 and breaks below $407.5, the put activity suggests a downside acceleration. Consider a short position targeting $405, with a stop-loss above $408. A protective put option at the $407.5 strike could be utilized.
The neutral gamma environment means that whichever direction TSLA initiates a move, market makers will be forced to chase the price, amplifying momentum.
⚠️ TRADING SCENARIOS
Today's market is characterized by SPY's neutral gamma on the edge of its Zero Gamma Pivot and QQQ's negative gamma bias, suggesting potential for amplified moves around key levels.
🟢 Bullish Case:
The bullish scenario for SPY activates if it decisively breaks and holds above its Zero Gamma Pivot of $691.00. A sustained push above this level would shift SPY into positive gamma territory, compelling market makers to buy dips and sell rallies. This hedging behavior would likely dampen volatility and create a more orderly, upward grind. The initial target in this scenario would be $695, with an ultimate aim towards the $700 Call Wall, where increasing resistance is expected. For QQQ, a sustained break above $614 (its Max Pain) would indicate a strong move, potentially pushing towards $617.5, despite its negative gamma environment. The trigger for this would likely be broad market strength overriding local gamma dynamics.
🔴 Bearish Case:
The bearish case for SPY materializes if it fails to hold $690.00 and definitively breaks below its Zero Gamma Pivot of $691.00. As SPY is currently at $690.80, this is an immediate threat. A move below $691.00 would entrench SPY in negative gamma, causing market makers to sell into weakness, accelerating any downside momentum. The initial target would be $687.5, followed by a test of the $680 Put Wall, which should provide significant support. For QQQ, a break below its Zero Gamma Pivot of $612.02 would be a strong bearish signal. Given its negative gamma and high put/call imbalance, a move below $612.02 could quickly accelerate towards $607.5, driven by dealer selling into the decline.
🟡 Choppy/Range-Bound Case:
A choppy or range-bound scenario is most likely if SPY remains tightly pinned around its Zero Gamma Pivot of $691.00. With a neutral Net GEX, the market lacks a strong directional gamma bias, leading to a "pinning" effect. In this case, SPY would likely trade within a tight range between $689.00 and $693.00. Market makers would be hedging intra-day swings, but without a significant breach of $691.00, no strong directional momentum would build. Similarly, QQQ could remain range-bound between $610.00 and $614.00 if it oscillates around its $612.02 Zero Gamma Pivot and $614 Max Pain. In this scenario, short-term mean reversion strategies would be favored, with trades fading moves towards the edges of these defined ranges.


Comments
Post a Comment