SPY: The $673.13 Zero Gamma Pivot Decides Everything Today
SPY: The $673.13 Zero Gamma Pivot Decides Everything Today
📊 MARKET OVERVIEW
The options market is signaling a challenging environment for stability today, with both SPY and QQQ exhibiting significant negative Net GEX readings. SPY currently stands at $-5.38 Billion in Net GEX, while QQQ reports $-4.38 Billion. This substantial negative gamma positioning across the major indices implies that market makers are largely short gamma, a condition that typically leads to increased volatility and amplified price movements. In a negative gamma regime, dealers are forced to buy into strength and sell into weakness to maintain their delta neutrality, thereby accelerating existing trends rather than dampening them. This dynamic means that any initial directional move is likely to gain momentum as market makers chase price action.
The VIX, currently at 26.99, further corroborates this expectation of elevated volatility. A VIX reading approaching 27 indicates a market bracing for significant swings, aligning perfectly with the negative gamma landscape. The Put/Call Imbalance Ratios are also telling: SPY's ratio is 9.90 and QQQ's is 5.94. These extremely high ratios suggest a strong bias towards put options in the market, indicating widespread hedging or outright bearish positioning. This heavy put overhang, particularly in a negative gamma environment, means that any downward pressure could trigger further put selling by dealers, exacerbating declines. Conversely, if price manages to push higher, the decay of these out-of-the-money puts could provide some relief, but the primary implication is one of vulnerability to downside momentum. We anticipate a day where price action around key technical levels will be sharp, with potential for rapid expansion in either direction once a pivot is breached.
🎯 KEY STRUCTURAL LEVELS
Understanding the precise structural levels derived from options gamma is paramount for navigating today's market. These levels represent points where market maker hedging activity is concentrated, acting as significant gravitational forces or inflection points for price.
| Index | Spot Price | Major Call Wall (Resistance) | Major Put Wall (Support) | Zero Gamma Pivot (Vol Expansion) | Max Pain |
| SPY | $672.80 | $700 | $680 | $673.13 | $685 |
| QQQ | $602.35 | $610 | $585 | $602.00 | $606 |
SPY Analysis:
The SPY is trading just below its Zero Gamma Pivot of $673.13. This level is critical: a sustained break above it would likely trigger increased buying from dealers unwinding short delta positions, potentially leading to a rapid ascent. Conversely, inability to reclaim this pivot could see downside momentum accelerate. The Major Put Wall at $680 acts as a significant near-term support, representing a level where large put open interest provides a floor, and dealers holding these short puts would become active buyers if approached. The Major Call Wall at $700 is a formidable resistance, implying that any rally towards this level would be met with aggressive selling by dealers hedging their long call exposure. Max Pain at $685 suggests that options contracts expiring today would cause the maximum financial loss for the largest number of option holders if SPY closes at this price. This level often acts as an magnetic anchor for price as expiration approaches.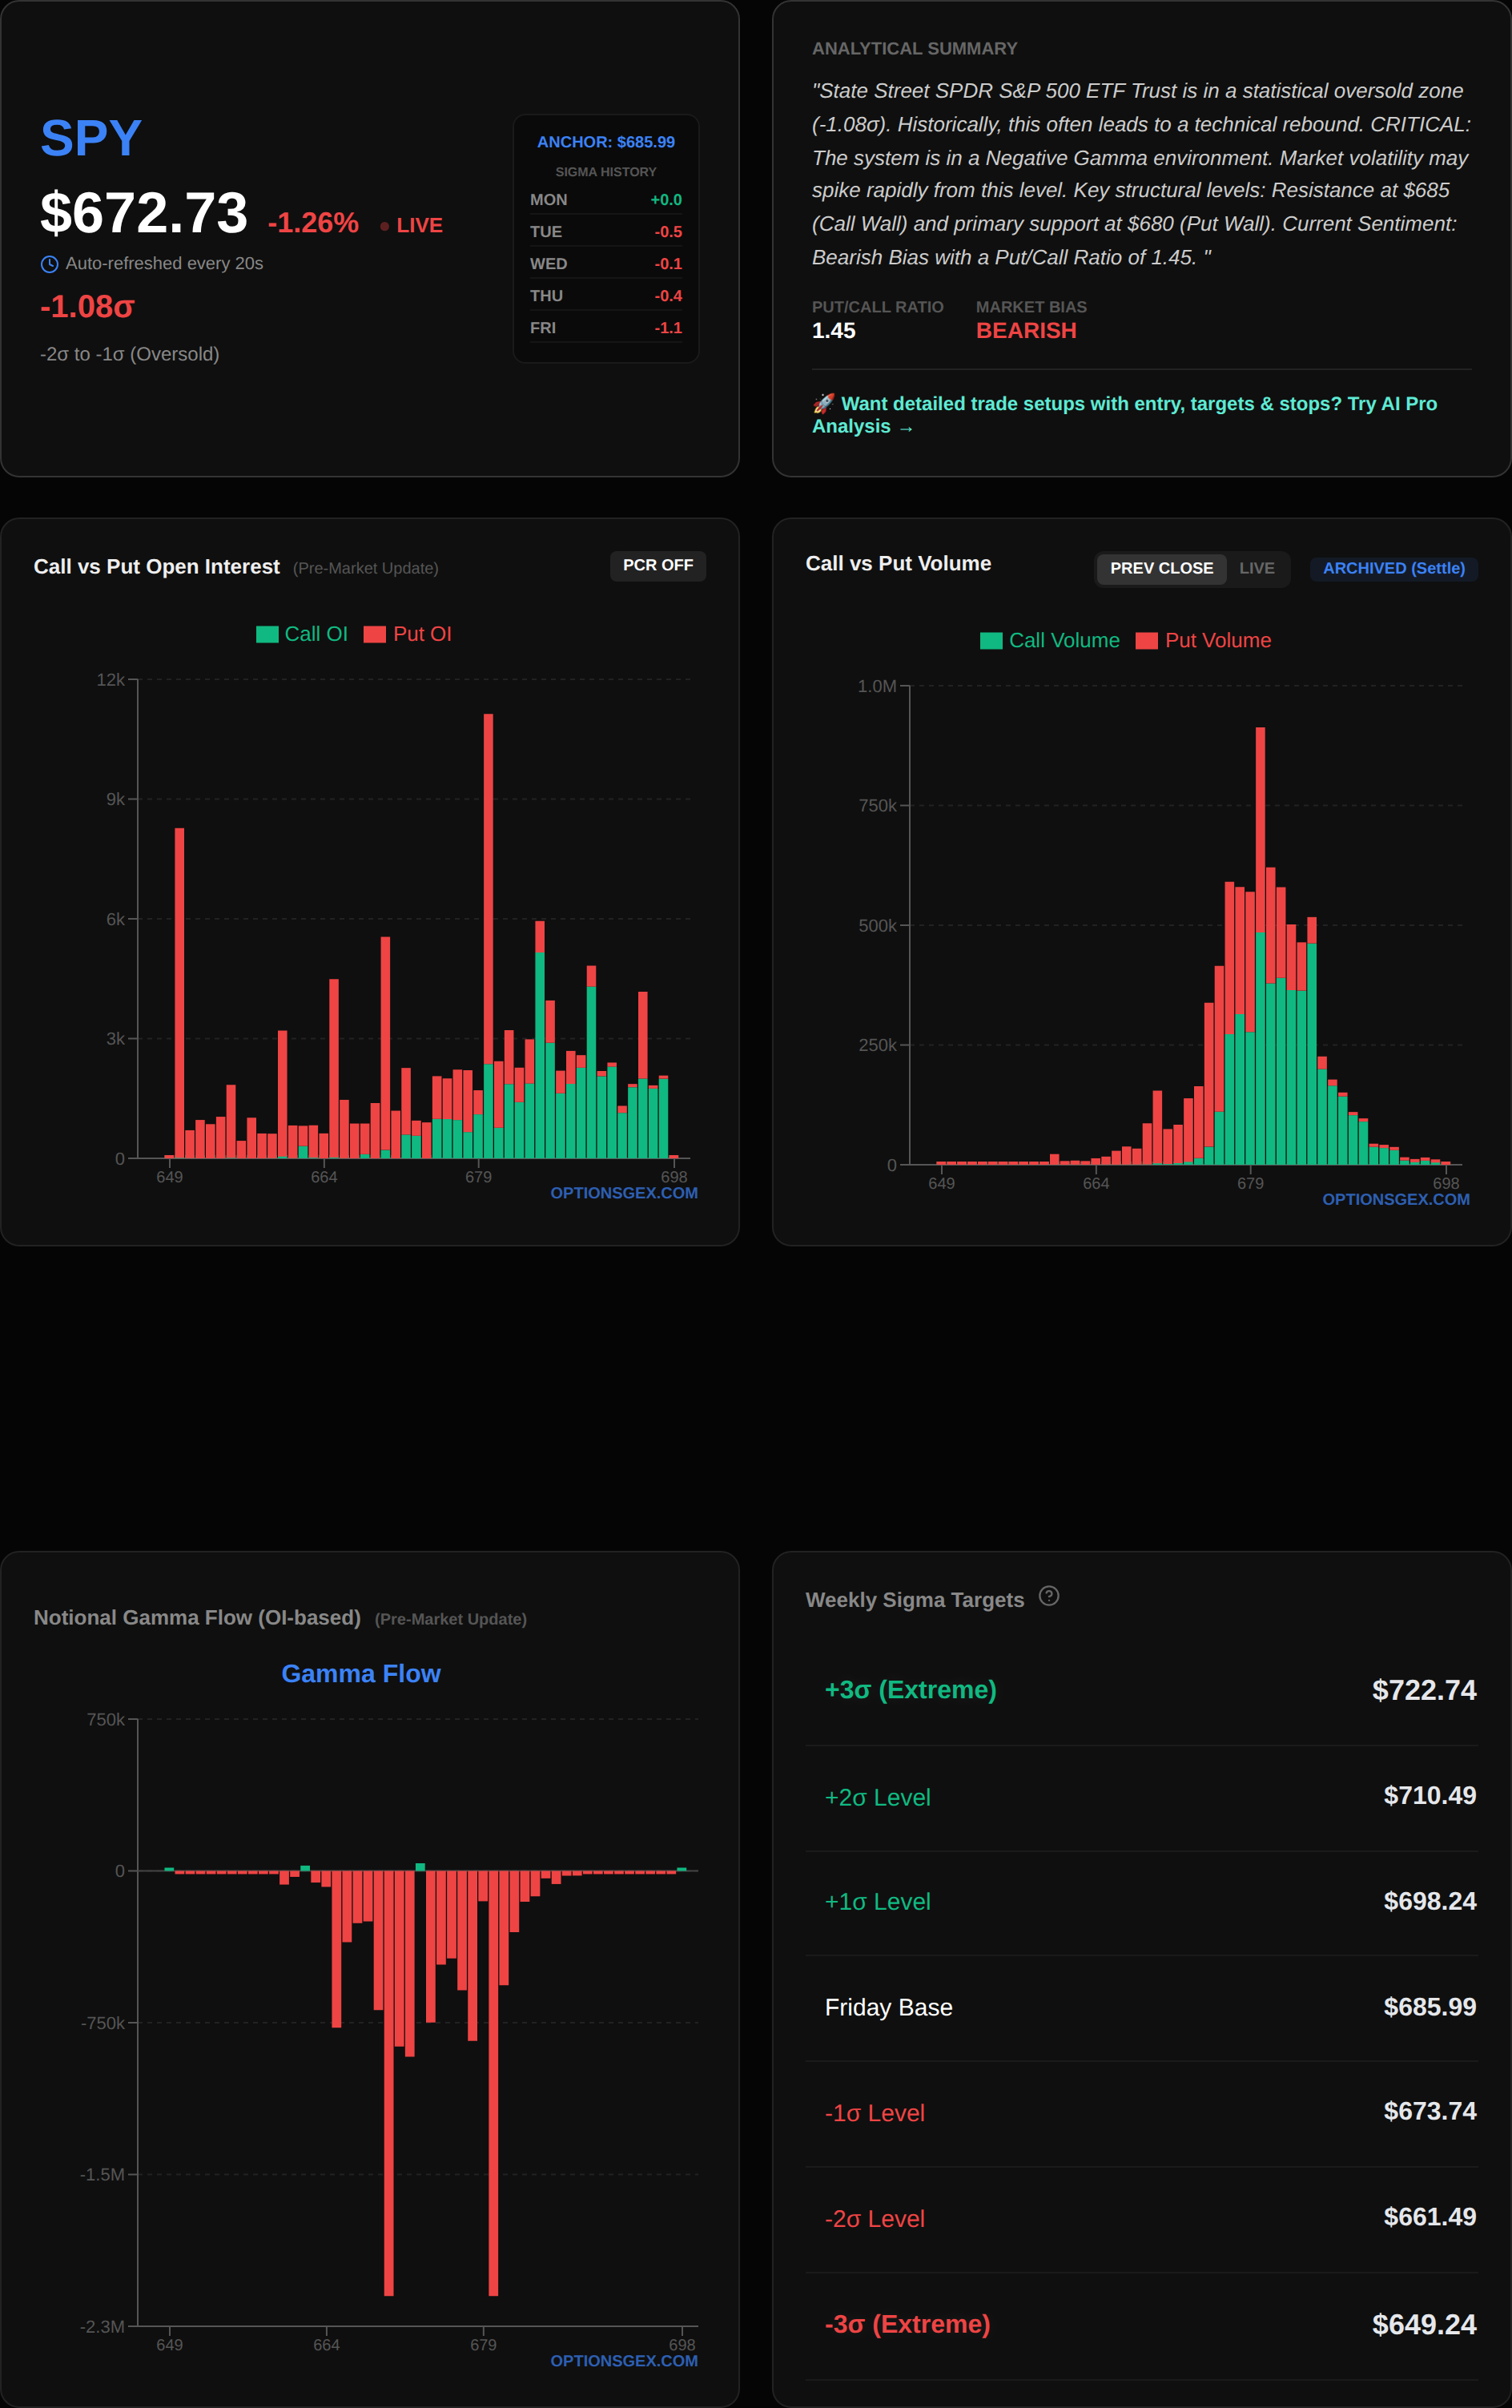
QQQ Analysis:
QQQ is positioned almost precisely at its Zero Gamma Pivot of $602.00. This makes the initial hours of trading crucial for determining its directional bias. A clear break above $602.00 could ignite a swift move higher, while a failure to hold this level could see it slide. The Major Put Wall at $585 provides robust structural support, indicating a heavy concentration of put options that would necessitate dealer buying if approached. The Major Call Wall at $610 represents a strong ceiling, where concentrated call open interest would likely lead to aggressive delta hedging by market makers, capping upside. Max Pain for QQQ is at $606, which suggests a tendency for price to gravitate towards this level by expiration.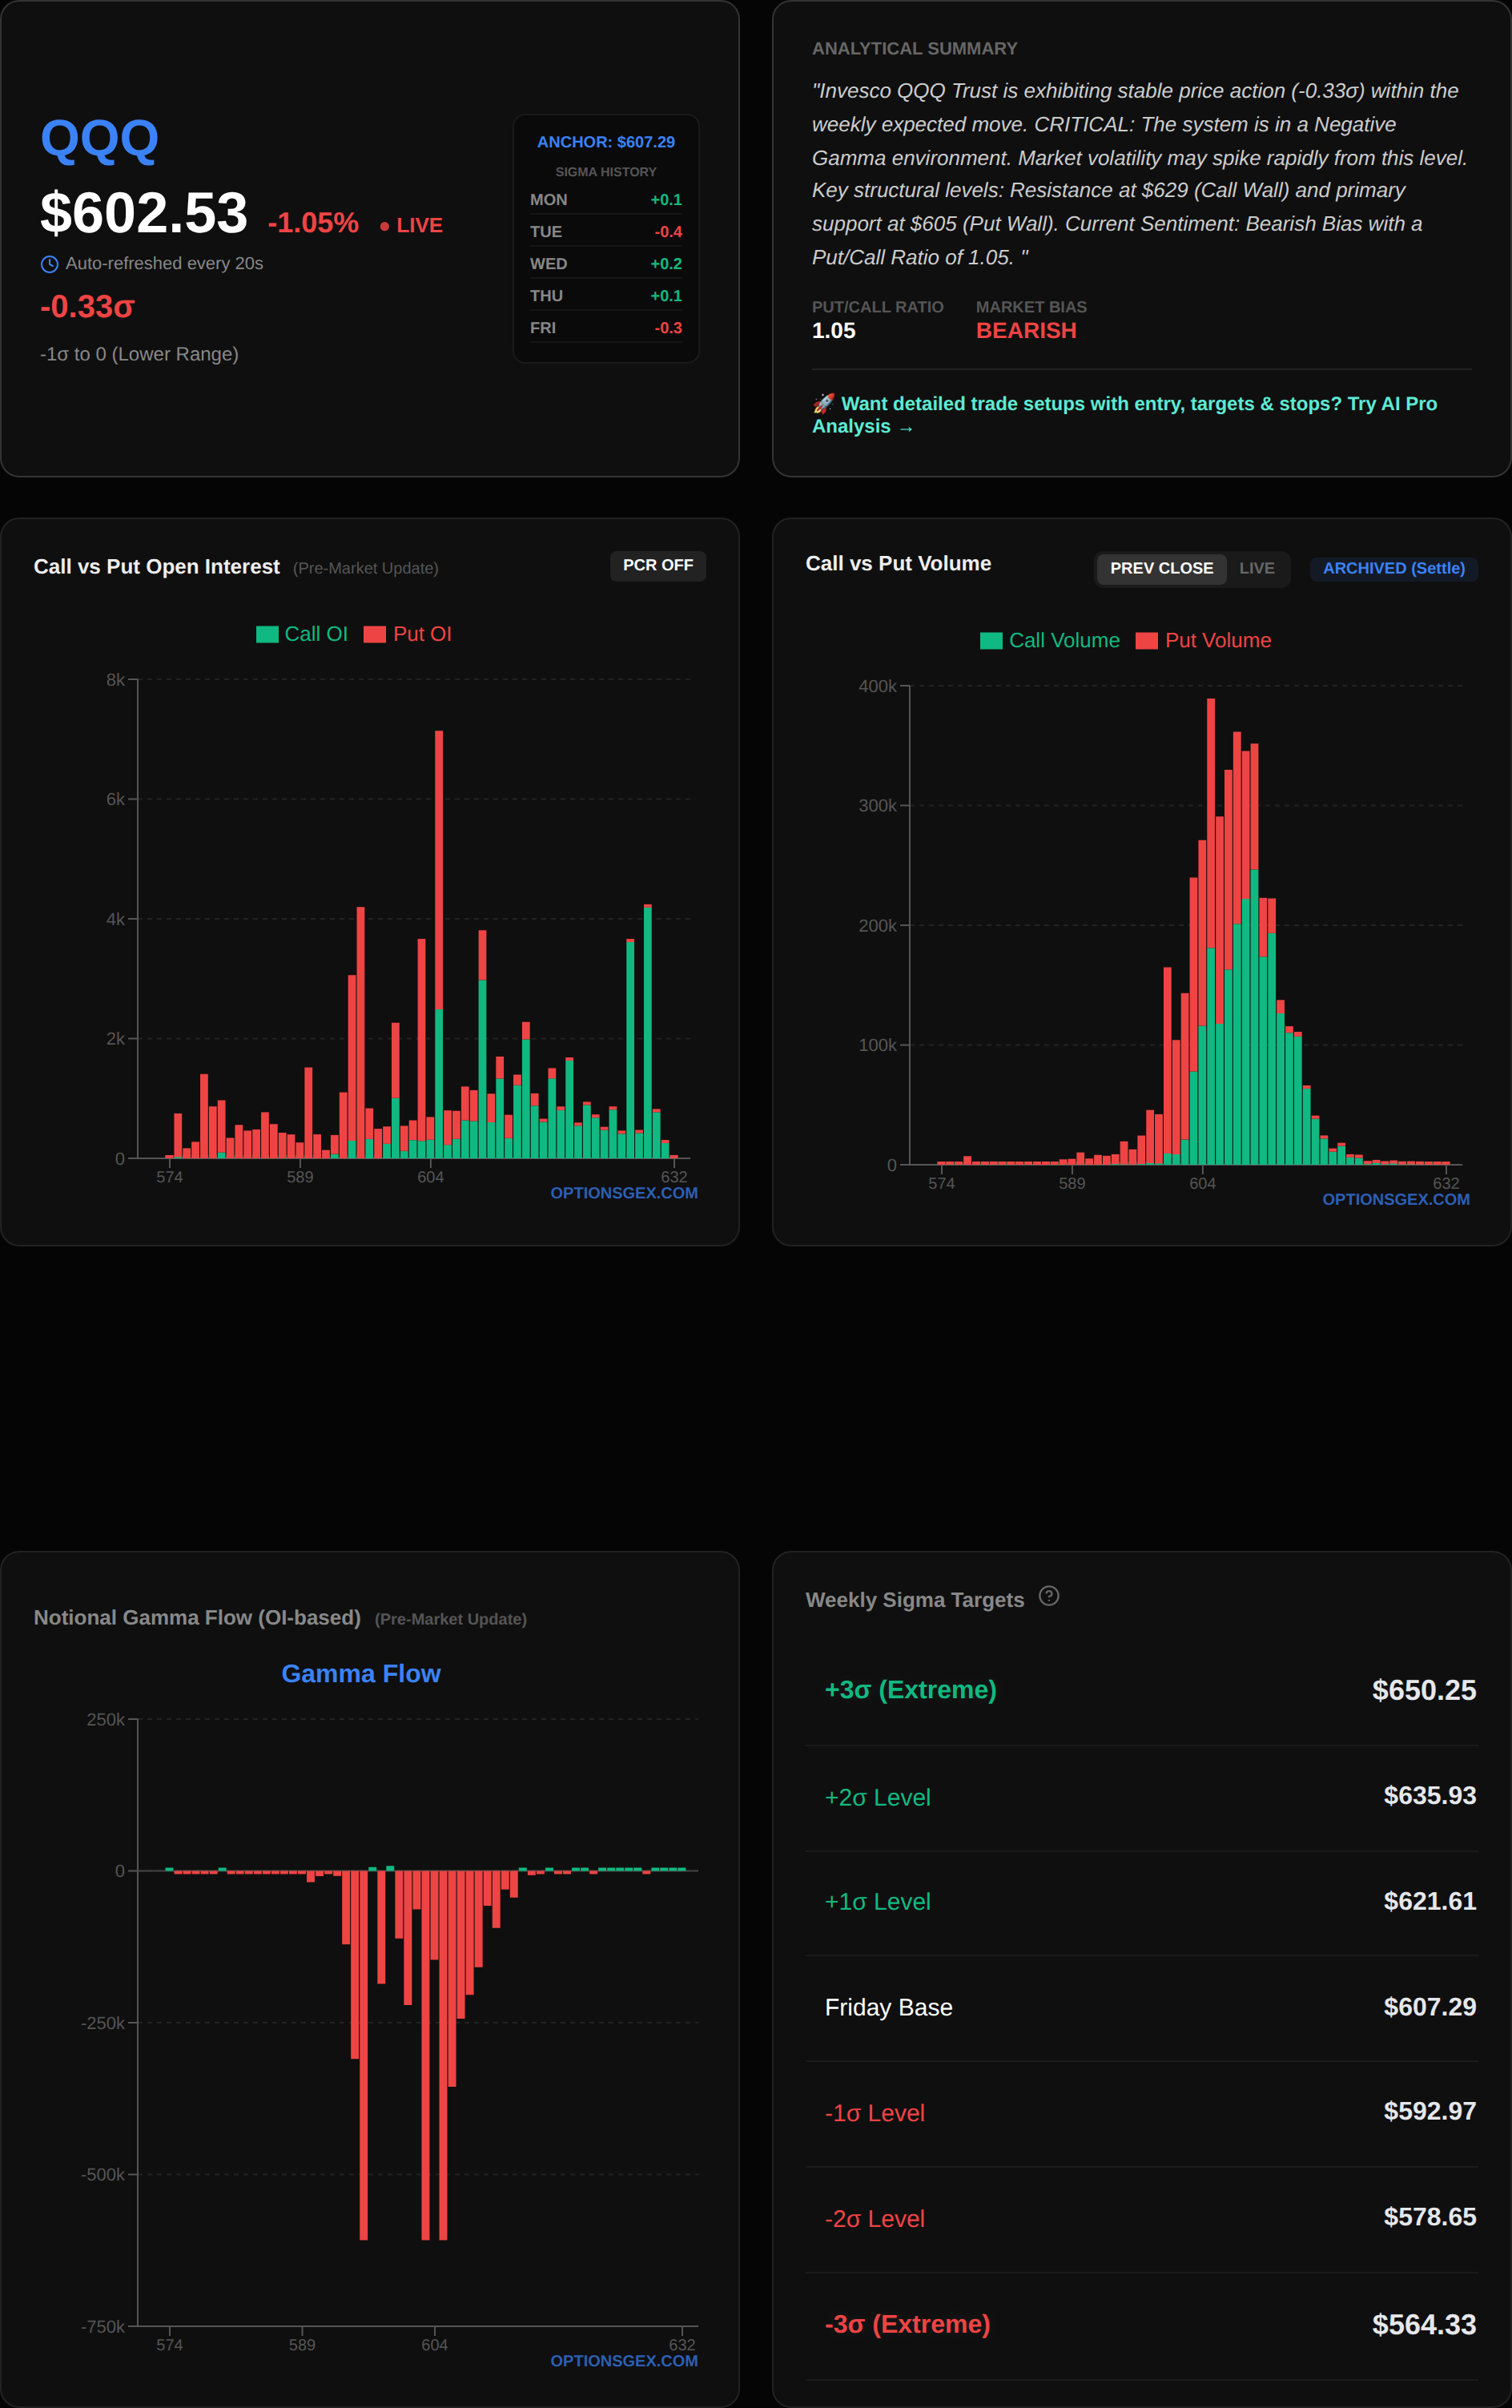
Given the negative Net GEX for both indices, a breach of these Zero Gamma Pivots will likely result in an accelerated move rather than a reversal, as dealers are forced to chase price to re-hedge.
🔥 UNUSUAL FLOW RADAR: Today's Smart Money Targets
Today's options flow highlights significant activity in TSLA and AAPL, with specific strikes seeing unusually high volume relative to their existing open interest. This often indicates institutional positioning or informed trading, warranting close attention.
### TSLA - Unusual Flow Alert
TSLA, currently at $397.23, is flashing multiple signals of unusual options activity, particularly concentrated around its current spot price. The overall Net GEX for TSLA is $-0.37 Billion, indicating a negative gamma environment that could amplify price movements around these key levels. The Call Wall at $650 and Put Wall at $150 represent extreme long-term boundaries, but near-term action is dominated by the following:
- CALL Strike $397.5: This strike saw 9,131 contracts trade against an Open Interest (OI) of 1,756, yielding a volume-to-OI ratio of 5.2x. A ratio this high is highly unusual, indicating significant new positioning rather than just closing trades. With a gamma of 0.3803 and IV of 28.2%, this is a very active, near-the-money strike.
- PUT Strike $395: 27,395 contracts traded versus 8,541 OI, a 3.2x ratio. This is a massive volume for a slightly out-of-the-money put, suggesting aggressive bearish positioning or hedging. Its gamma is 0.1054 with an IV of 53.8%, indicating heightened expectations of downside volatility.
📊 Analyze any ticker yourself: Visit optionsgex.com to view live GEX profiles and Sigma levels for over 500 stocks.
- CALL Strike $400: 22,192 contracts traded against 8,983 OI, a 2.5x ratio. This volume, while less extreme than the $397.5 call, still denotes substantial interest in a slightly out-of-the-money call, potentially indicating bullish speculative bets or hedging against short positions. Gamma here is 0.0151 with IV at 30.5%.
Analysis & Trade Idea:
The clustering of high-volume activity directly around the spot price of $397.23 for both calls and puts, particularly the $397.5 Call and $395 Put, indicates extreme tension and potential for a sharp move. The negative overall GEX for TSLA suggests that once a direction is established, momentum will likely accelerate. The $395 Put volume is exceptionally high, suggesting a strong downside bias or significant downside hedging. Given the high gamma on the $397.5 Call, a move above $397.5 could trigger swift dealer buying.
Actionable Trade Idea (Risk Warning): Given the high volume in puts and the negative GEX, a break below $395 could see a rapid acceleration lower. Conversely, a strong push above $397.5 could trigger a short squeeze. We would favor a strangle or iron condor strategy to capitalize on potential volatility expansion around these levels, but only for experienced traders due to the inherent risk. Alternatively, a bearish put spread targeting a move towards $390 if TSLA decisively breaks $395 (e.g., Buy TSLA $390 Put, Sell TSLA $385 Put) could be considered with a stop above $397.5.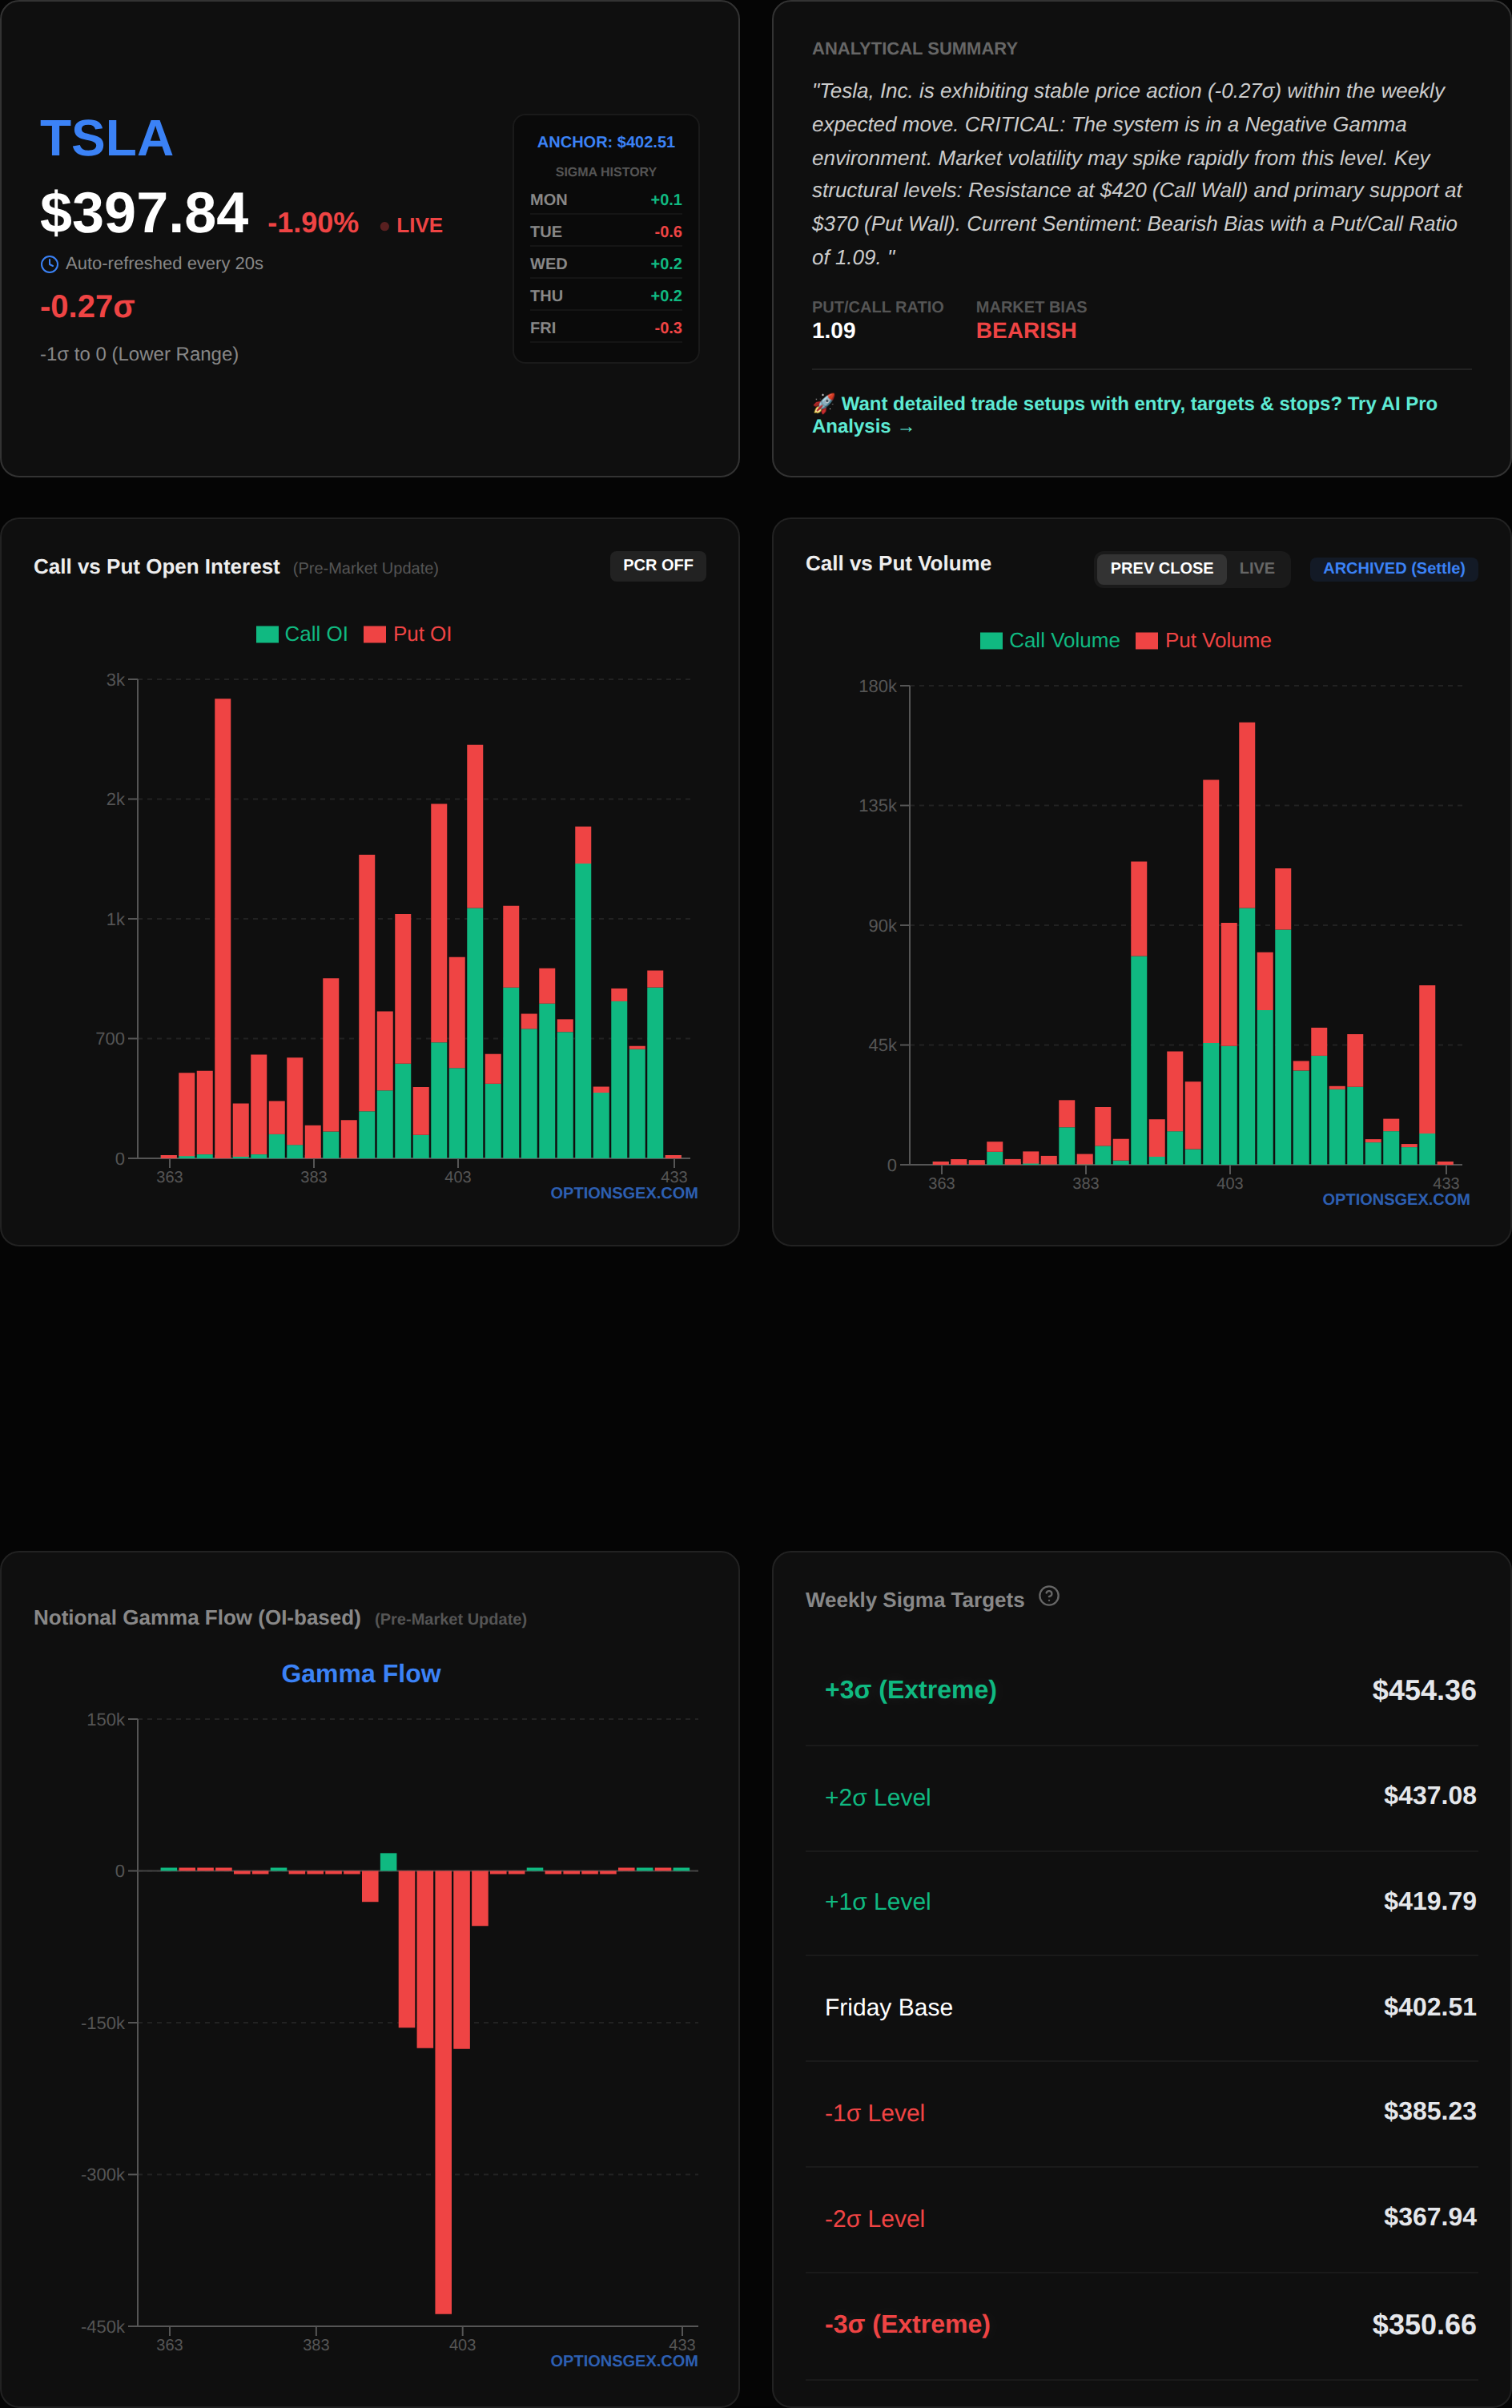
### AAPL - Unusual Flow Alert
AAPL, currently trading at $256.31, is also displaying notable options flow, though with a less dramatic overall Net GEX of $-0.12 Billion. The Call Wall at $270 and Put Wall at $250 define its broader range.
- CALL Strike $257.5: 8,633 contracts traded against 1,959 OI, a 4.4x ratio. This is a significant volume for a slightly out-of-the-money call, suggesting bullish conviction or hedging against short equity positions. Its gamma is 0.0486 with IV at 21.7%.
- PUT Strike $252.5: 10,617 contracts traded versus 2,944 OI, a 3.6x ratio. This is a substantial put volume, indicating either bearish bets or hedging against long equity. Gamma is 0.0000 (deep OTM) with IV at 38.5%.
- PUT Strike $247.5: 5,515 contracts traded against 2,401 OI, a 2.3x ratio. Another high-volume put, further underscoring downside protection or speculation. Gamma is 0.0000 (deep OTM) with IV at 36.9%.
Analysis & Risk Warning:
The unusual activity in AAPL shows a clear preference for calls just above the current spot price ($257.5) and a heavy concentration of puts further out-of-the-money ($252.5, $247.5). The high volume in the $257.5 Call suggests potential for a move higher, which could be amplified by market maker buying in a negative gamma environment. However, the substantial put volume indicates underlying concerns or hedging. The gamma at the put strikes is effectively zero, meaning these are likely directional bets or long-dated hedges, rather than short-term gamma plays.
Detailed Risk Warning: While the call volume is notable, the sheer volume in out-of-the-money puts cannot be ignored. This suggests that while there may be short-term bullish sentiment, significant players are positioning for potential downside. Traders should be cautious of a "head fake" rally. If AAPL pushes above $257.5, initial momentum could be strong. However, a failure to hold this level or a reversal below $256 could see it quickly target the $252.5 and $247.5 levels as the put volume acts as a magnet and dealers unwind long positions. A bullish call spread (e.g., Buy AAPL $257.5 Call, Sell AAPL $260 Call) could be considered if AAPL shows sustained strength above $257.5, but a tight stop below $256 is crucial.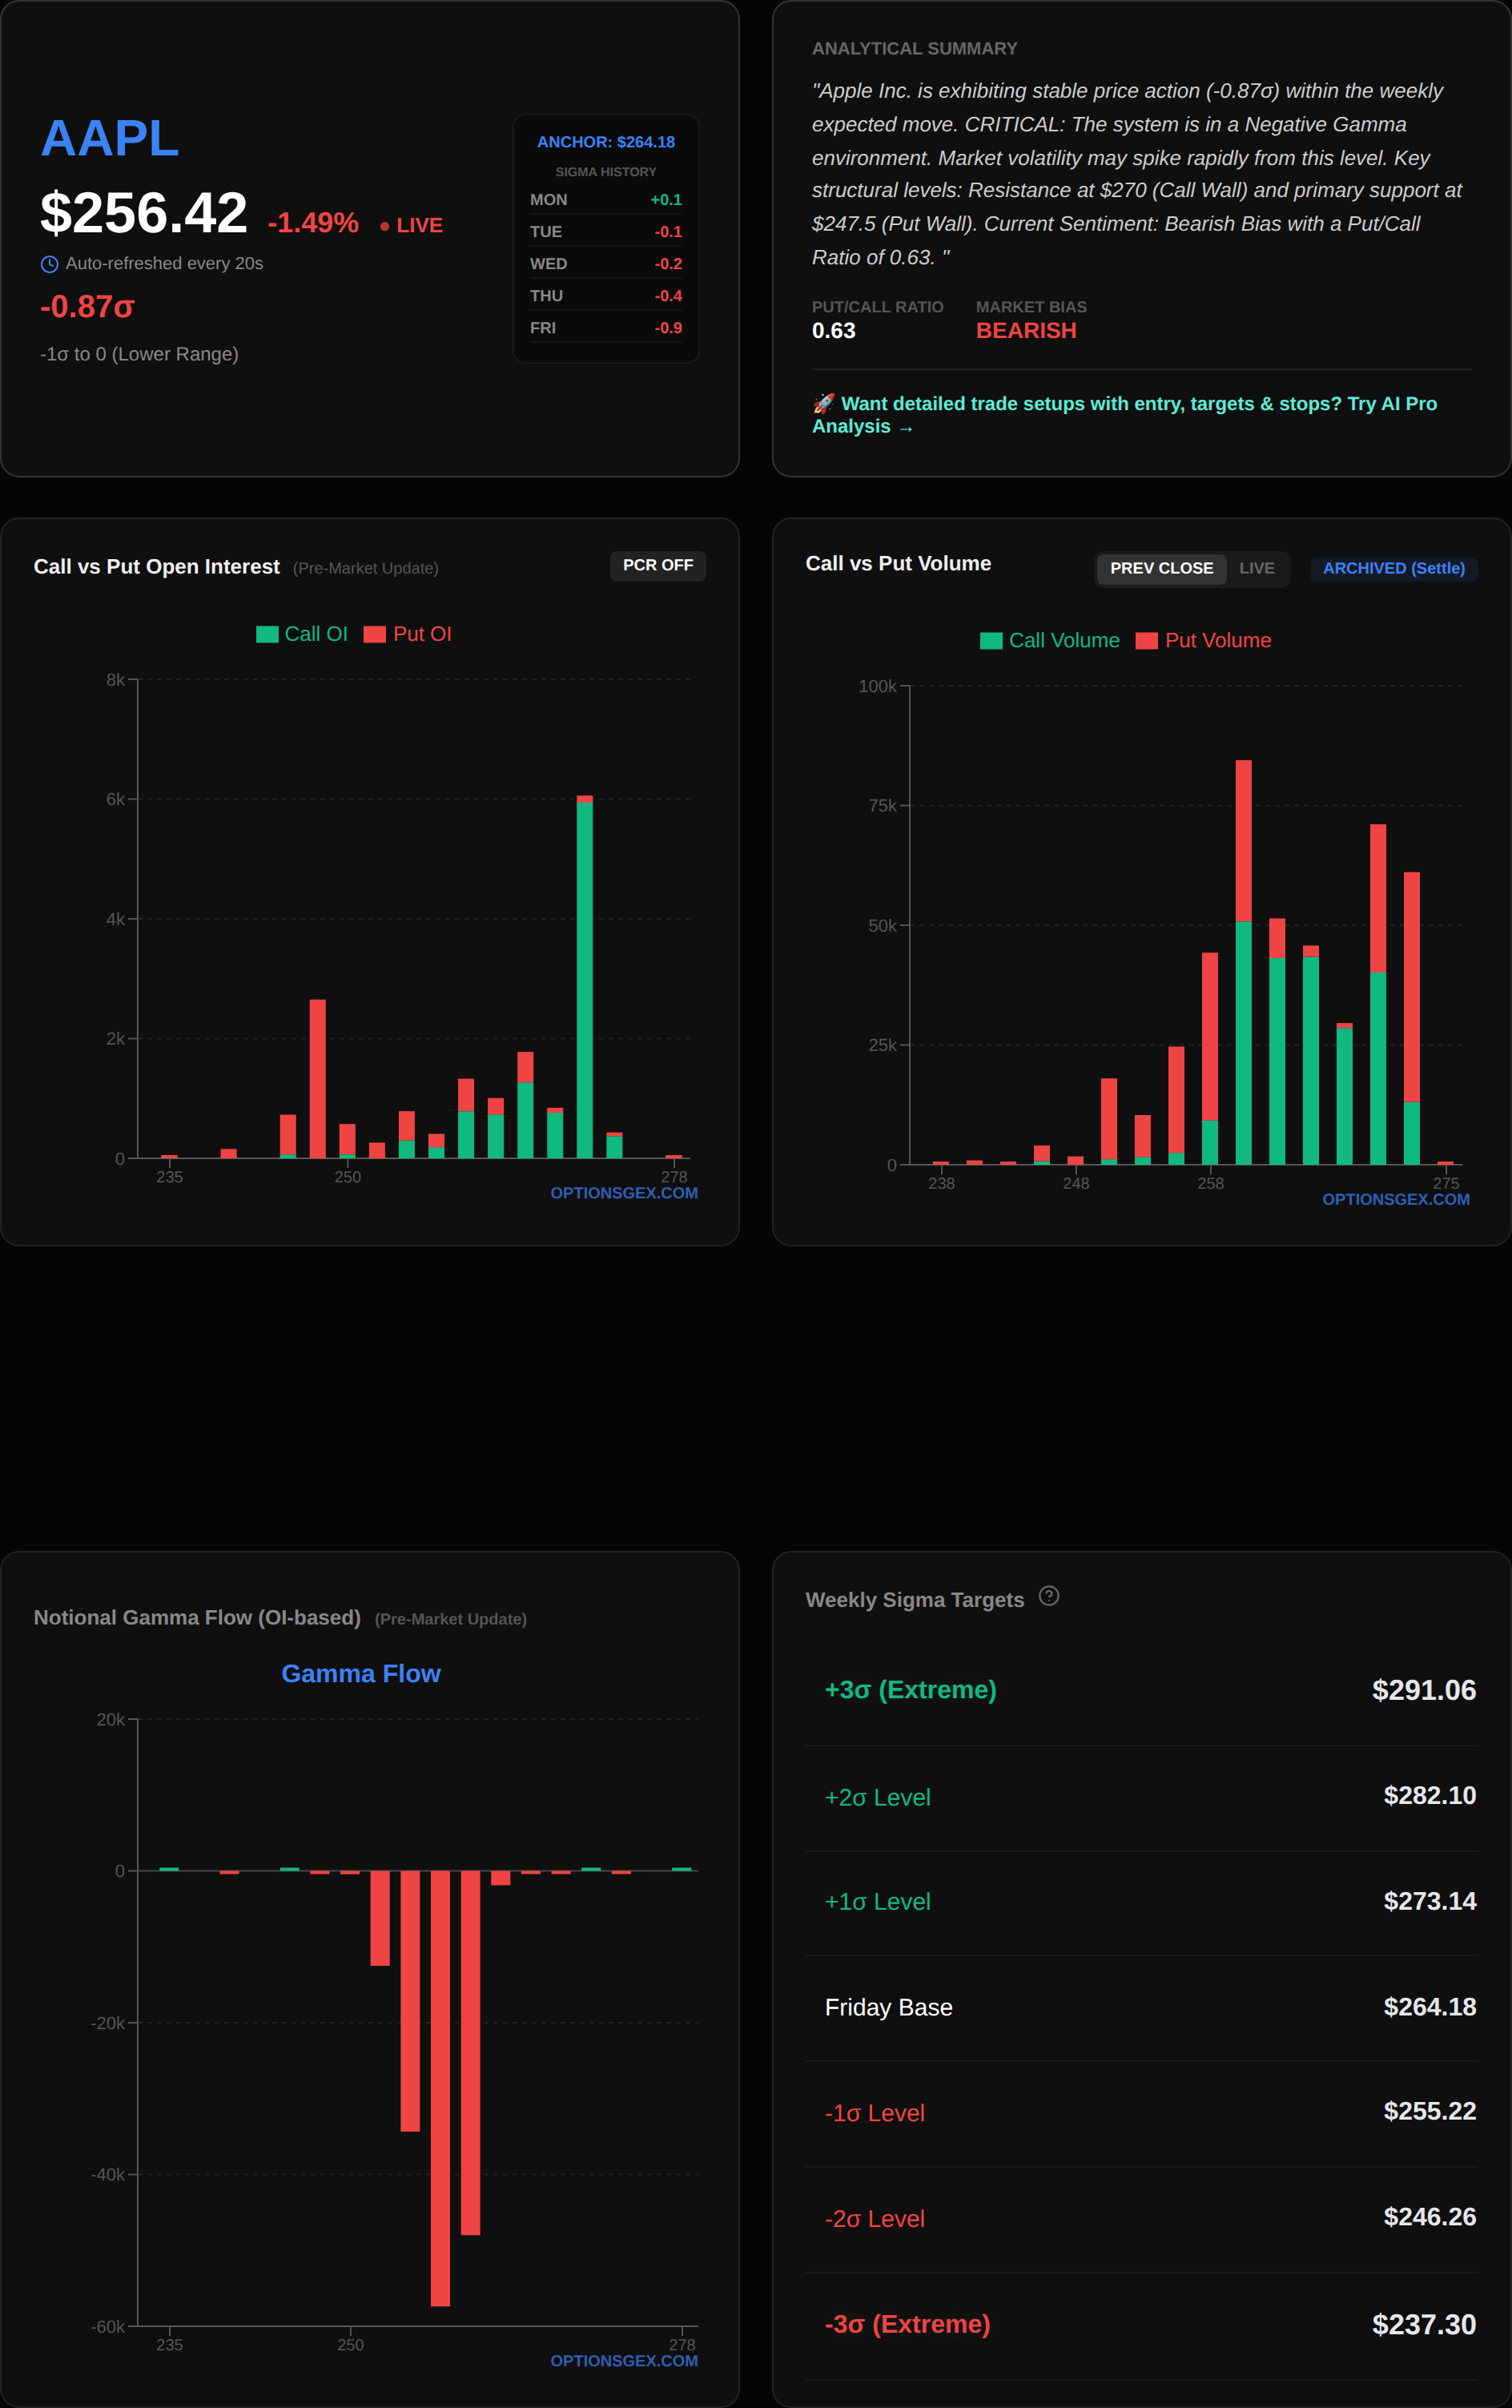
⚠️ TRADING SCENARIOS
Given the negative Net GEX across SPY and QQQ, coupled with the elevated VIX, we anticipate amplified price movements around key structural levels today.
🟢 Bullish Case
For a bullish scenario to unfold, SPY must decisively reclaim and hold its Zero Gamma Pivot at $673.13. If SPY breaks above $673.13 with conviction, the negative gamma environment will force market makers to buy deltas to re-hedge, creating a positive feedback loop. This could trigger a rapid ascent towards the SPY Max Pain level of $685, and potentially challenge the Put Wall at $680. Similarly, for QQQ, a sustained move above its Zero Gamma Pivot at $602.00 would likely initiate a momentum-driven rally towards its Max Pain at $606, with the next target being the $610 Call Wall. This scenario would be characterized by sharp, upward acceleration.
🔴 Bearish Case
The bearish case is equally potent given the current market structure. If SPY fails to hold its current level and breaks below $670, especially if it cannot reclaim the $673.13 Zero Gamma Pivot, downside momentum will likely accelerate. The negative gamma implies that dealer selling into weakness will amplify declines. A break below $670 could see SPY swiftly move towards $665, with potential for a deeper test towards $660 as dealers aggressively de-risk. For QQQ, a failure to hold $602.00 and a subsequent break below $600 would open the door for a rapid decline towards $595, with the Put Wall at $585 acting as a significant ultimate support target. This scenario would be marked by rapid, cascading downside action.
🟡 Choppy/Range-Bound Case
A choppy or range-bound scenario, while less likely given the negative Net GEX, could still materialize if price action remains tightly consolidated around the Zero Gamma Pivots. For SPY, this would mean price oscillating between approximately $670 and $675. Dealers would be actively hedging within this narrow range, but without a clear directional trigger, the overall market maker short gamma would not be fully activated for a breakout. For QQQ, a range-bound day would see it trade between $600 and $605, hugging its Zero Gamma Pivot at $602.00. In this scenario, we would expect intermittent volatility spikes but no sustained directional trend, as the market awaits a catalyst to push it definitively out of the negative gamma "volatility trap" around the zero gamma level.


Comments
Post a Comment