SPY: The $683.00 Zero Gamma Pivot Defines Today's Volatility
SPY: The $683.00 Zero Gamma Pivot Defines Today's Volatility
📊 MARKET OVERVIEW
As of the morning of March 2, 2026, the options market presents a nuanced picture for both SPY and QQQ, with critical pivots set to dictate intraday volatility. The SPY spot price is $682.90, while QQQ stands at $604.01. Both indices are currently exhibiting a Net GEX of $0.00 Billion, which, while seemingly neutral, implies a very specific market dynamic. A Net GEX at or near zero suggests that the market is hovering around its Zero Gamma Pivot. This is a critical inflection point where market maker hedging behavior shifts dramatically. In such an environment, the market is highly susceptible to increased volatility as dealers transition from being gamma-neutral to either short gamma (accelerating moves) or long gamma (dampening moves).
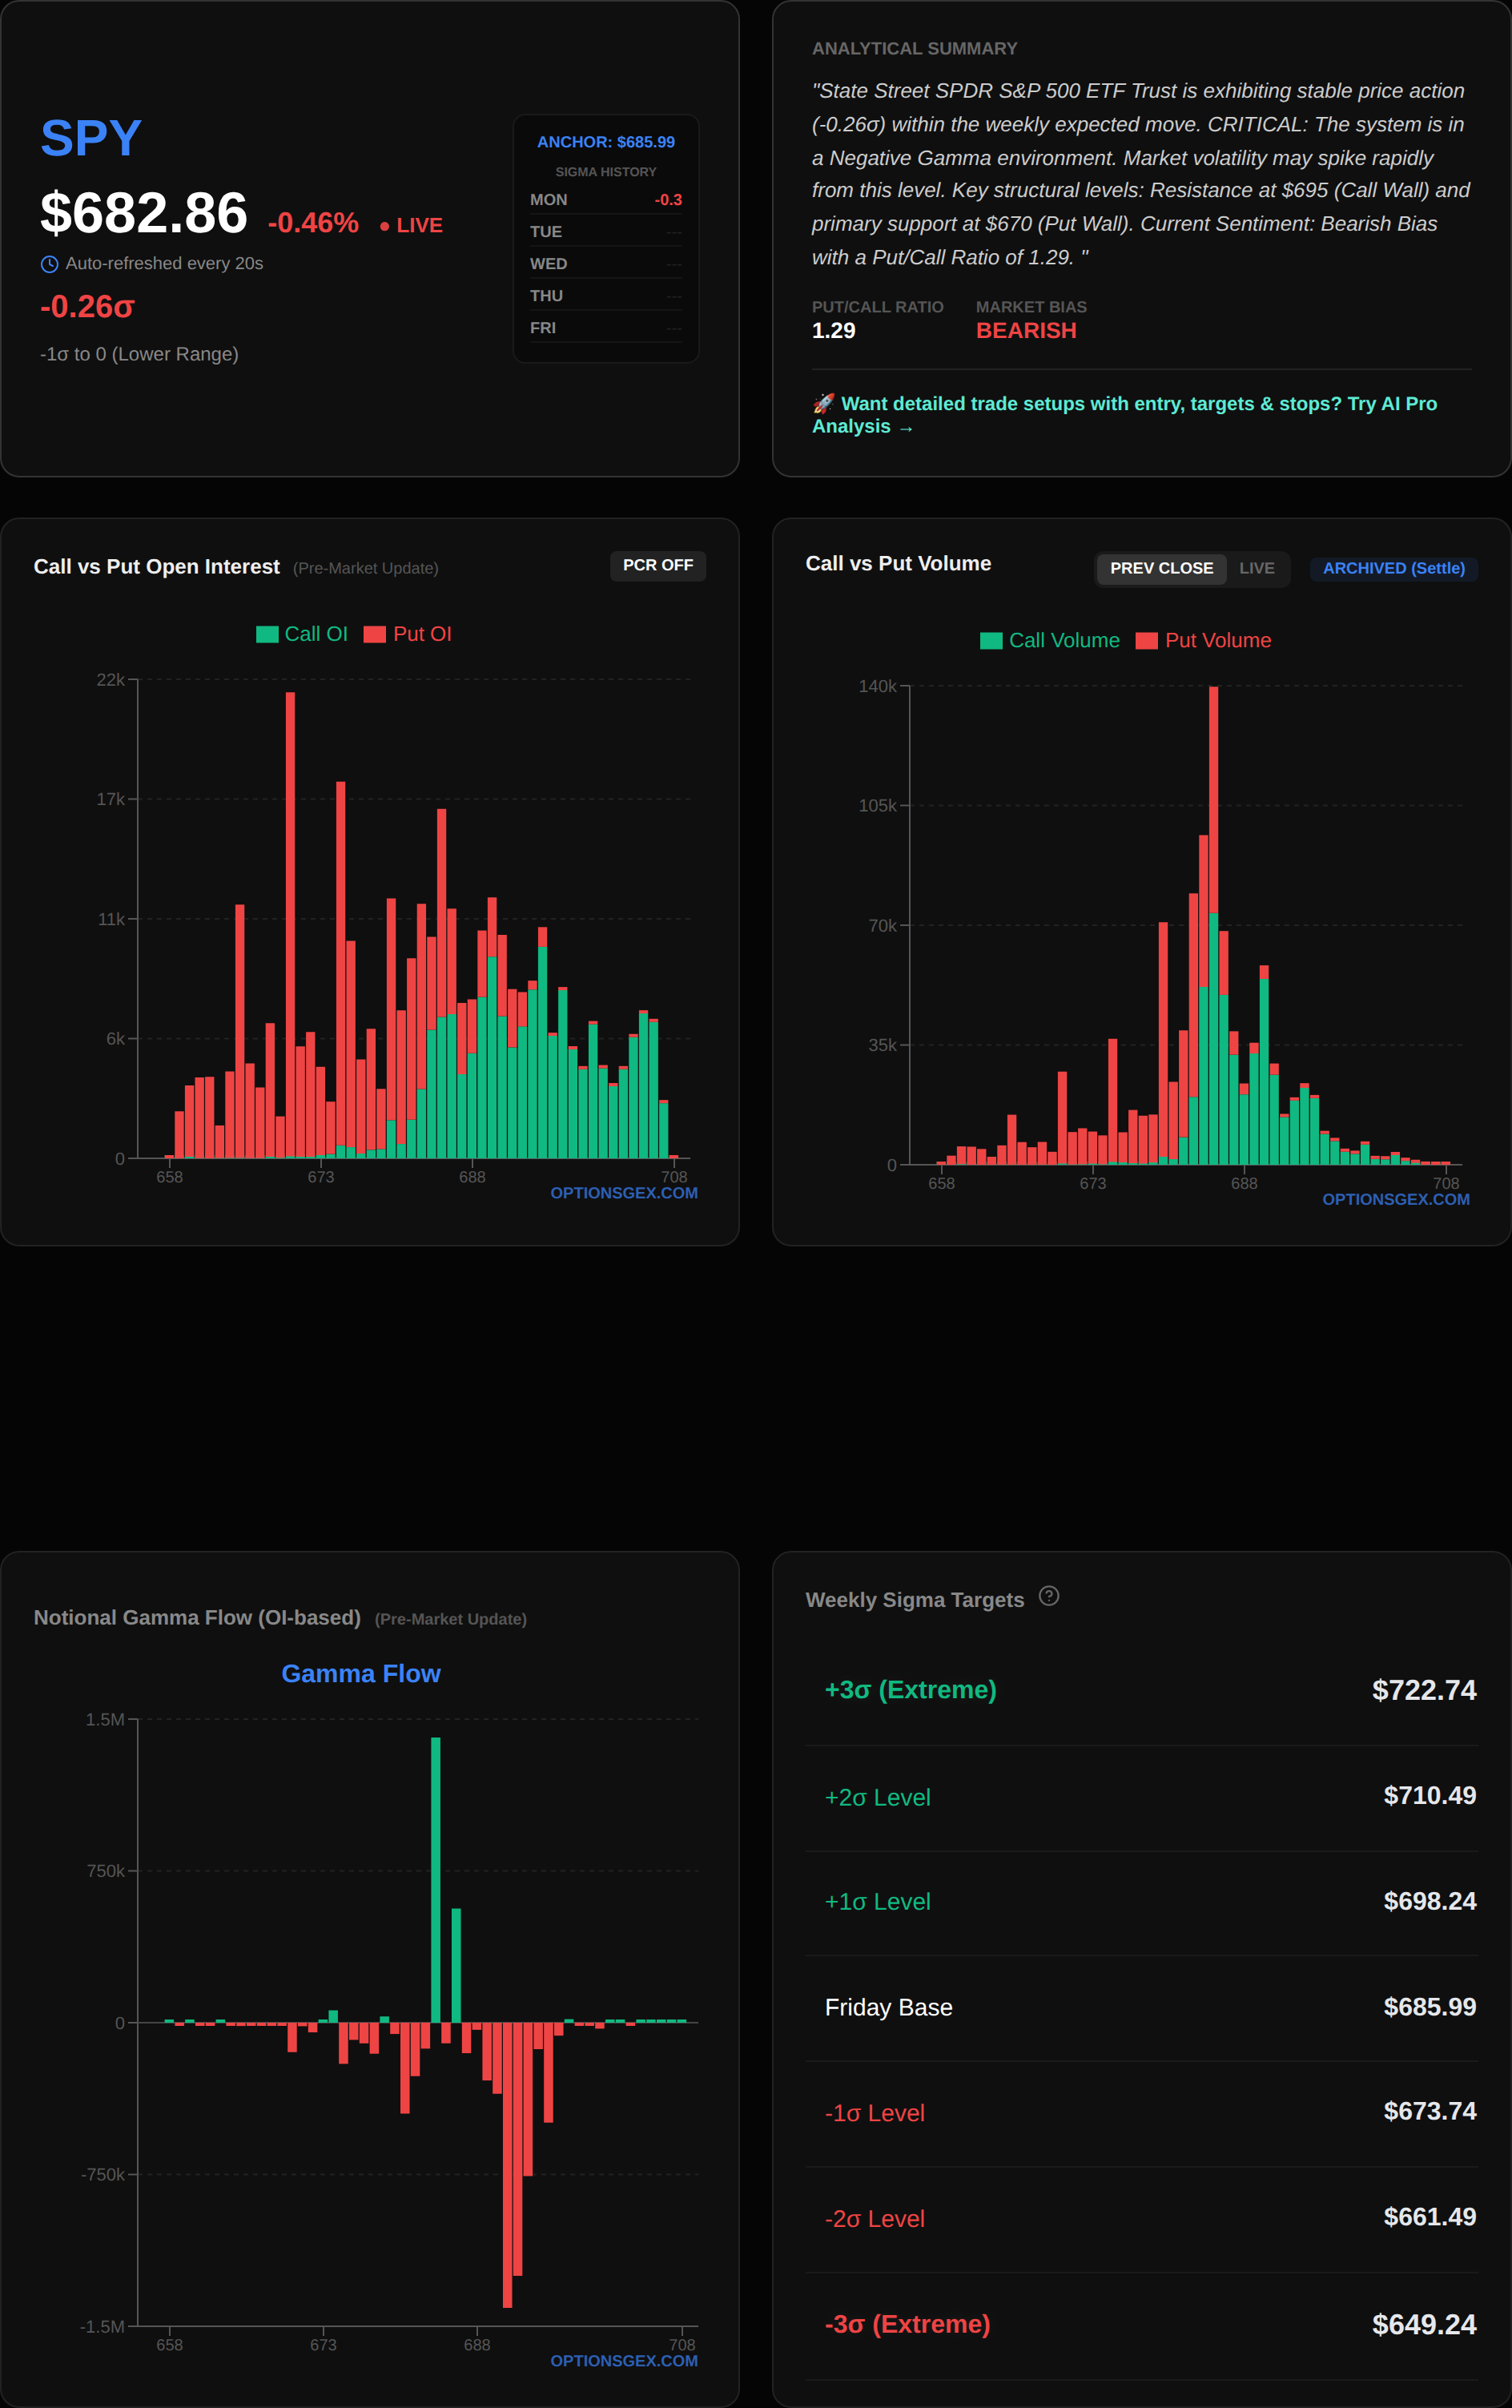
For SPY, the Zero Gamma Pivot is precisely at $683.00. With SPY spot at $682.90, we are essentially at this critical juncture. This means that any sustained move above $683.00 could trigger positive gamma effects, where dealers would buy into strength, potentially dampening further upside. Conversely, a sustained move below $683.00 could push dealers into a short-gamma position, forcing them to sell into weakness and thus accelerating downside momentum. The Put/Call Imbalance Ratio for SPY is 0.00, indicating a balanced sentiment, which further emphasizes the importance of the Zero Gamma Pivot as the primary directional catalyst.
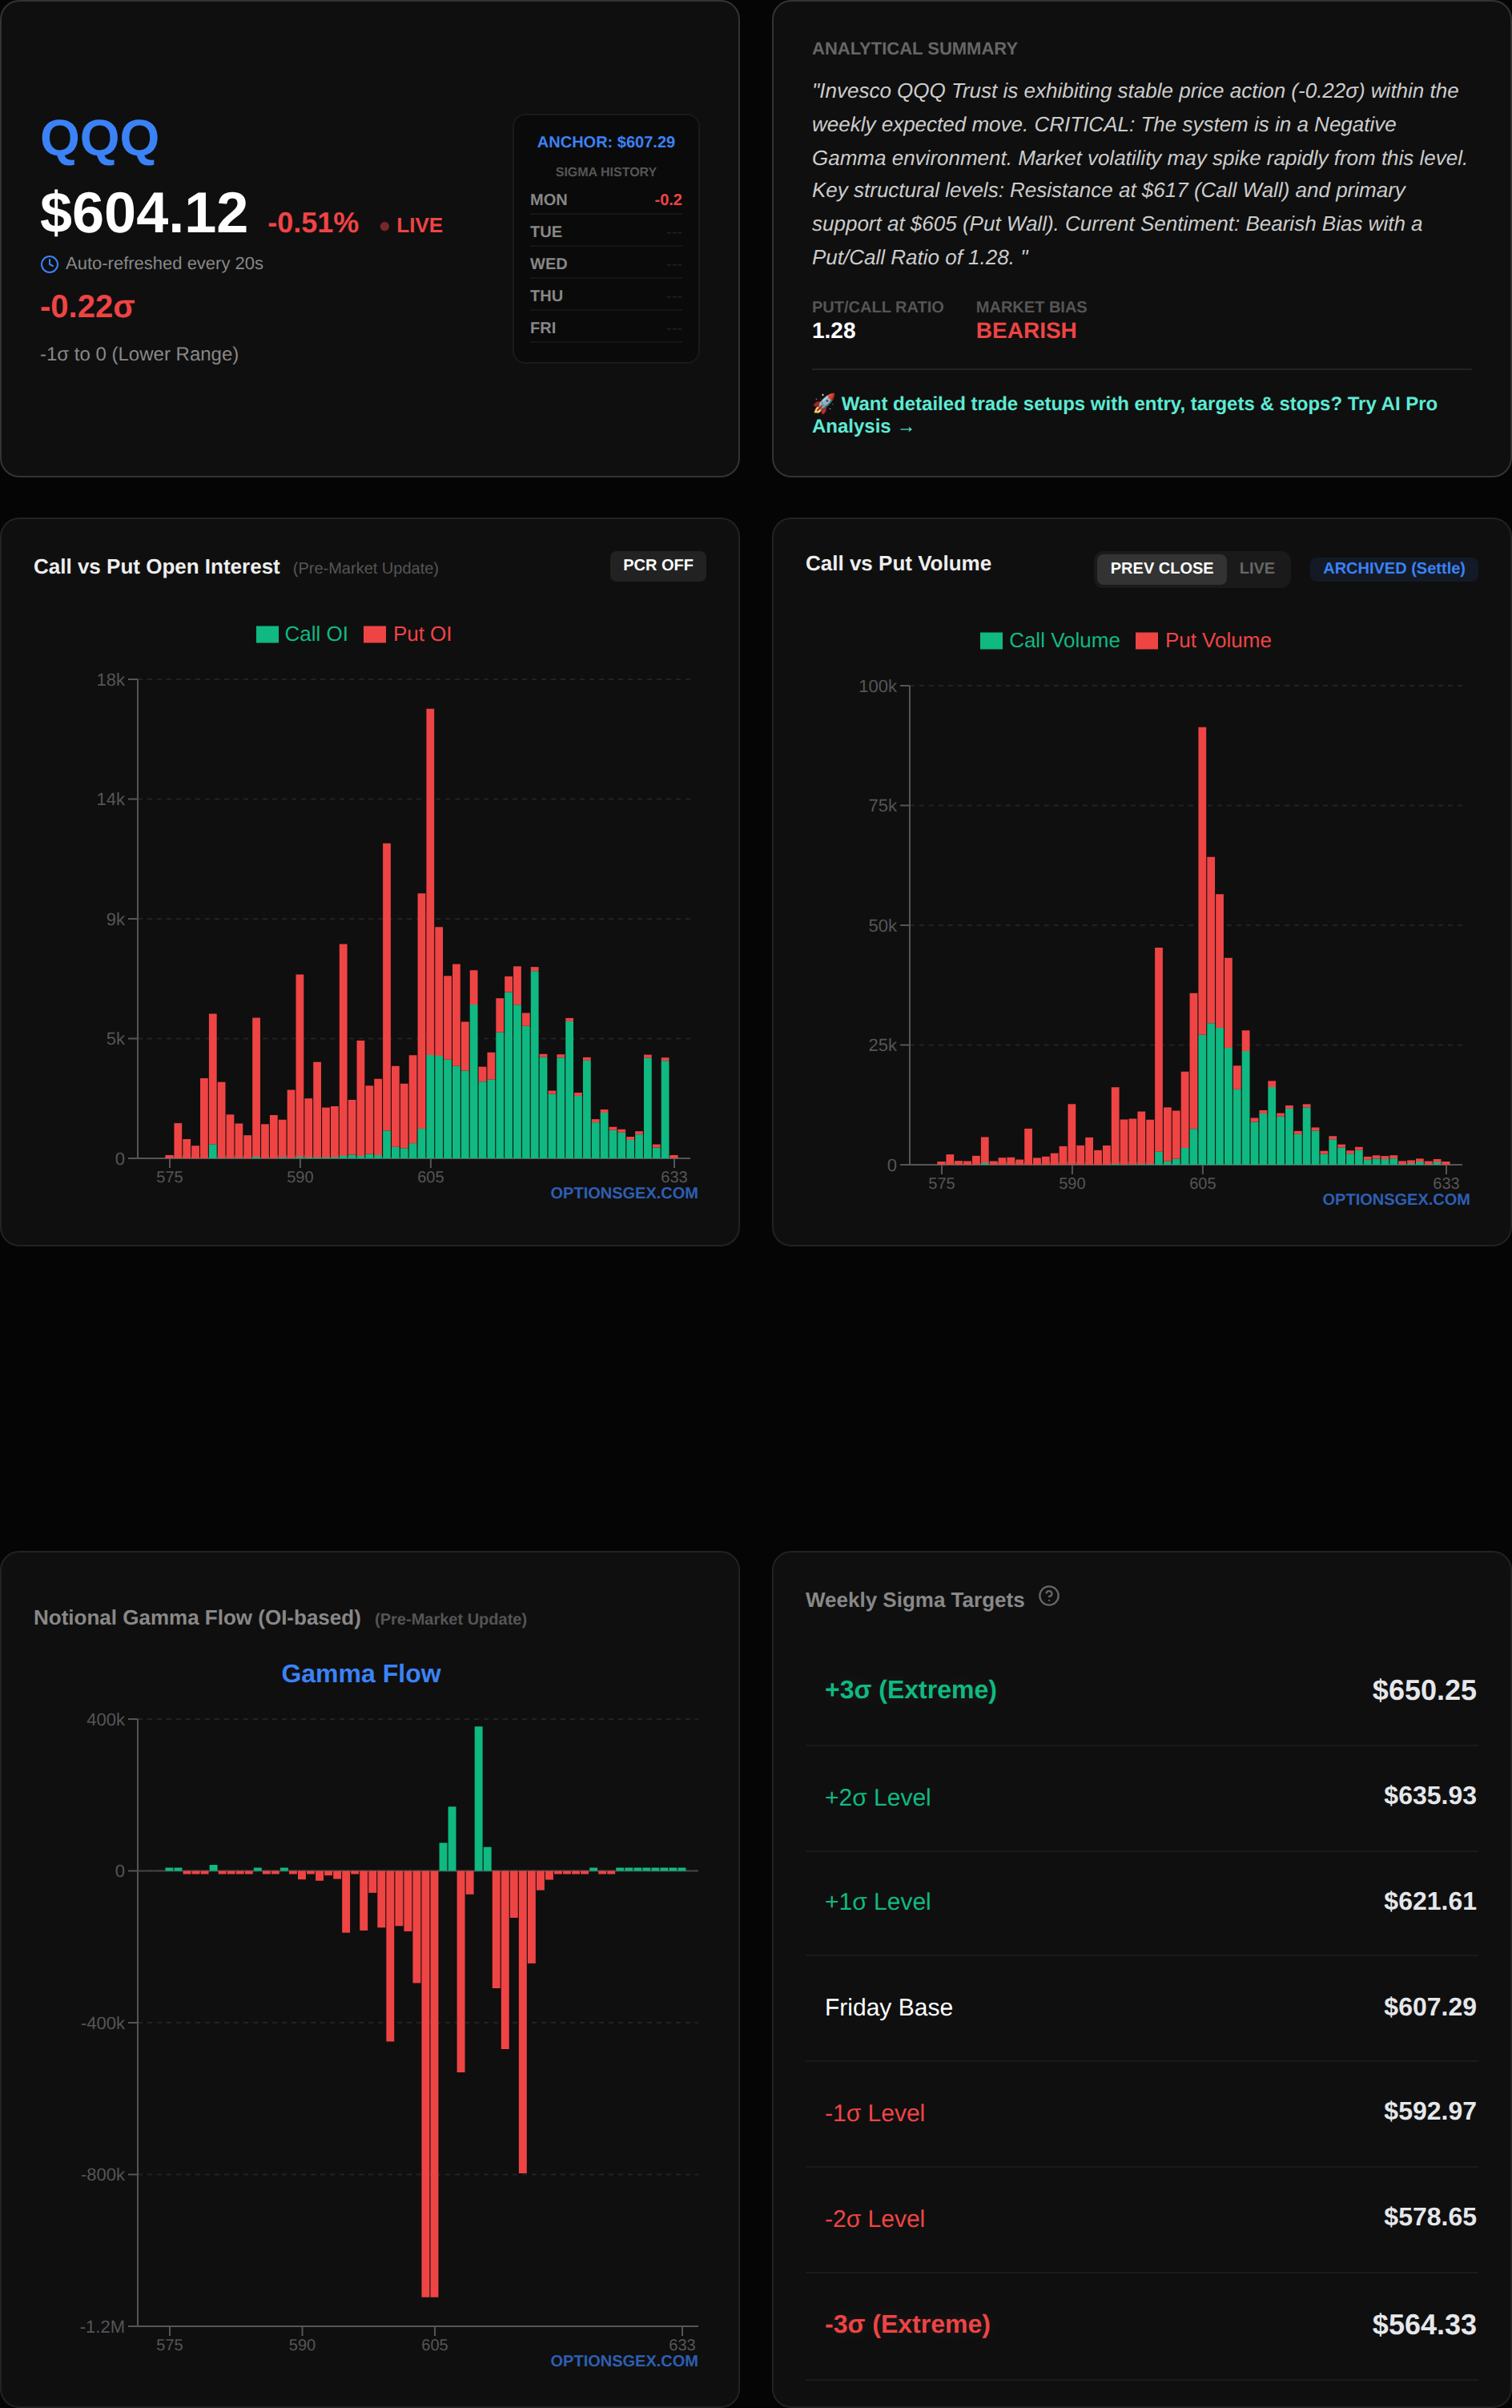
QQQ mirrors this precarious positioning, with its Zero Gamma Pivot at $604.00, almost perfectly aligned with its spot price of $604.01. The QQQ also shows a Net GEX of $-0.00 Billion, reinforcing the same heightened volatility potential around its pivot. The astronomical QQQ Put/Call Imbalance Ratio of 8.07e+31 is an anomaly likely due to data sparsity at certain strikes, thus we will primarily focus on the GEX and structural levels for QQQ. The VIX closed at 22.14, indicating an elevated level of implied volatility, which is entirely consistent with a market poised at zero gamma, where small price movements can trigger significant hedging flows and amplify price action. This environment is ripe for sharp, sudden moves in either direction, with market makers acting as amplifiers rather than stabilizers until a clear direction is established away from the zero gamma point.
🎯 KEY STRUCTURAL LEVELS
Understanding the precise structural levels for SPY and QQQ is paramount for navigating today's trading landscape, as these levels dictate critical market maker hedging flows.
| Index | Spot Price | Call Wall (Resistance) | Put Wall (Support) | Zero Gamma Pivot (Vol Expansion) | Max Pain |
| SPY | $682.90 | $695 | $670 | $683.00 | $686 |
| QQQ | $604.01 | $617 | $605 | $604.00 | $607 |
For SPY, the Zero Gamma Pivot at $683.00 is the most critical level today. With the spot price directly below this at $682.90, a break above $683.00 would likely flip dealers to a long-gamma stance, where they would buy into rallies and sell into dips, thus dampening volatility and potentially creating a range-bound environment between $683.00 and the Max Pain point of $686. Conversely, a failure to reclaim $683.00 and a sustained move lower would push dealers into a short-gamma position, forcing them to sell into weakness, accelerating any downside momentum towards the Put Wall at $670. The Call Wall at $695 represents significant overhead resistance, where large concentrations of call options reside, prompting market makers to aggressively sell into strength as price approaches this level to remain delta-neutral.
Similarly for QQQ, the Zero Gamma Pivot at $604.00 is the immediate focal point, with the current spot price at $604.01. A move above $604.00 could see market makers become long gamma, leading to a more stable or even choppy ascent towards the Max Pain of $607. However, if QQQ fails to hold $604.00 and drifts lower, dealers will likely become short gamma, exacerbating downward pressure towards the Put Wall at $605. Note that the QQQ Put Wall at $605 is very close to the spot price, indicating a significant concentration of protective puts just below current levels. This could act as a strong immediate support but if breached, it could trigger further downside. The Call Wall at $617 stands as the primary resistance, where aggressive hedging from market makers will likely cap upside potential. Understanding these levels allows us to anticipate dealer flows and potential price acceleration or deceleration zones throughout the session.
🔥 UNUSUAL FLOW RADAR: Today's Smart Money Targets
TSLA
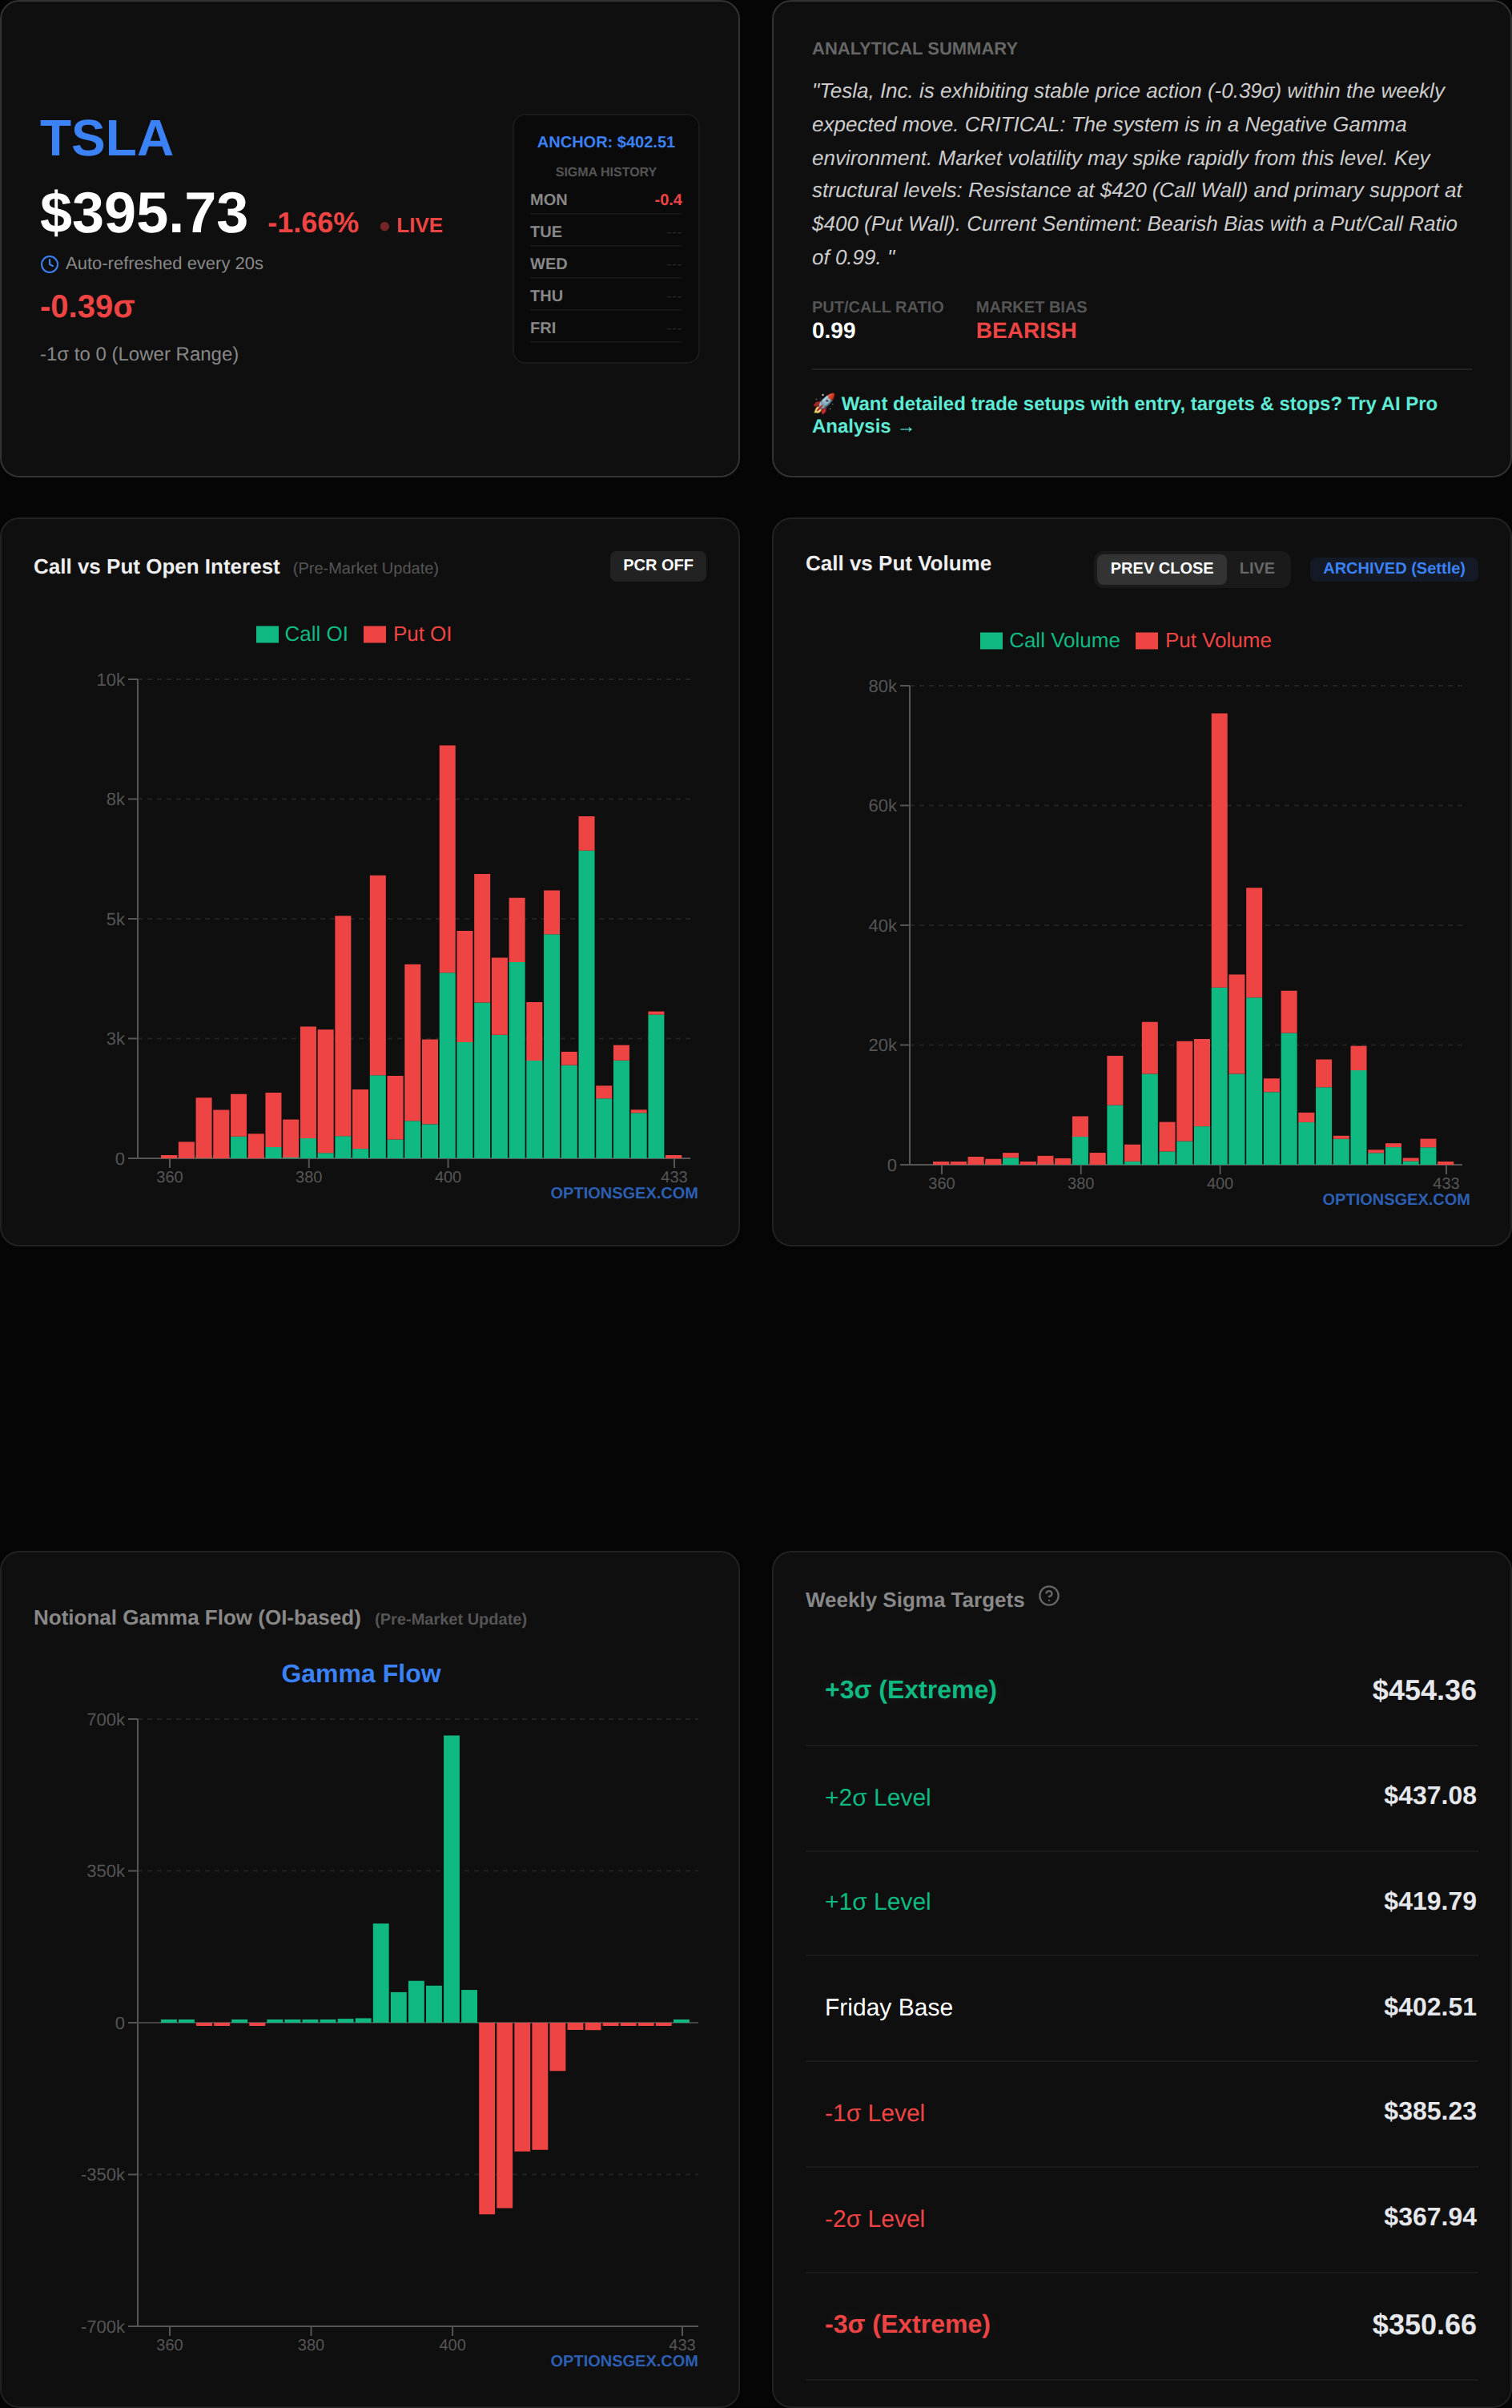
Tesla (TSLA) is flashing significant unusual call option activity this morning, indicating potential bullish smart money positioning. The spot price is $396.03. We are observing exceptionally high volume at specific call strikes relative to their open interest, which is a strong signal of new, aggressive positioning rather than simple position rollovers.
📊 Analyze any ticker yourself: Visit optionsgex.com to view live GEX profiles and Sigma levels for over 500 stocks.
Specifically, the CALL Strike $397.5 has seen a massive 6407 contracts traded against an Open Interest (OI) of only 713, representing a staggering 9.0x normal volume. This is highly unusual; typically, a volume-to-OI ratio above 2.0x is considered significant. The implied volatility (IV) for this strike is a low 1.6%, suggesting these are likely directional bets expecting a rapid move rather than a volatility play. Further out, the CALL Strike $405 shows 27926 contracts traded against an OI of 3252, an 8.6x normal volume, with an IV of 12.5%. The CALL Strike $400 also stands out with 29602 contracts traded against an OI of 3874, a 7.6x normal volume, at an IV of 6.3%.
The gamma for all these flagged strikes is currently 0.0000, which means they are far out-of-the-money or have very short expiries, making their gamma impact on market maker hedging negligible in the immediate term. However, the sheer volume in these out-of-the-money calls suggests a strong conviction for a rapid upside move in TSLA. The overall Net GEX for TSLA is $0.00 Billion, similar to the broader market, indicating it is also sensitive to its Zero Gamma Pivot. The Call Wall at $420 and Put Wall at $335 define the broader expected range, but the immediate focus is on the accumulation of calls just above the current spot.
Actionable Trade Idea: Given the aggressive accumulation of calls just above the current spot, a break and sustain above $397.50 could trigger a short squeeze or momentum buying. A speculative long position in TSLA could be considered with a target towards $405, using a tight stop-loss just below $396.00 to manage risk. The high volume suggests these are fresh directional bets.
META
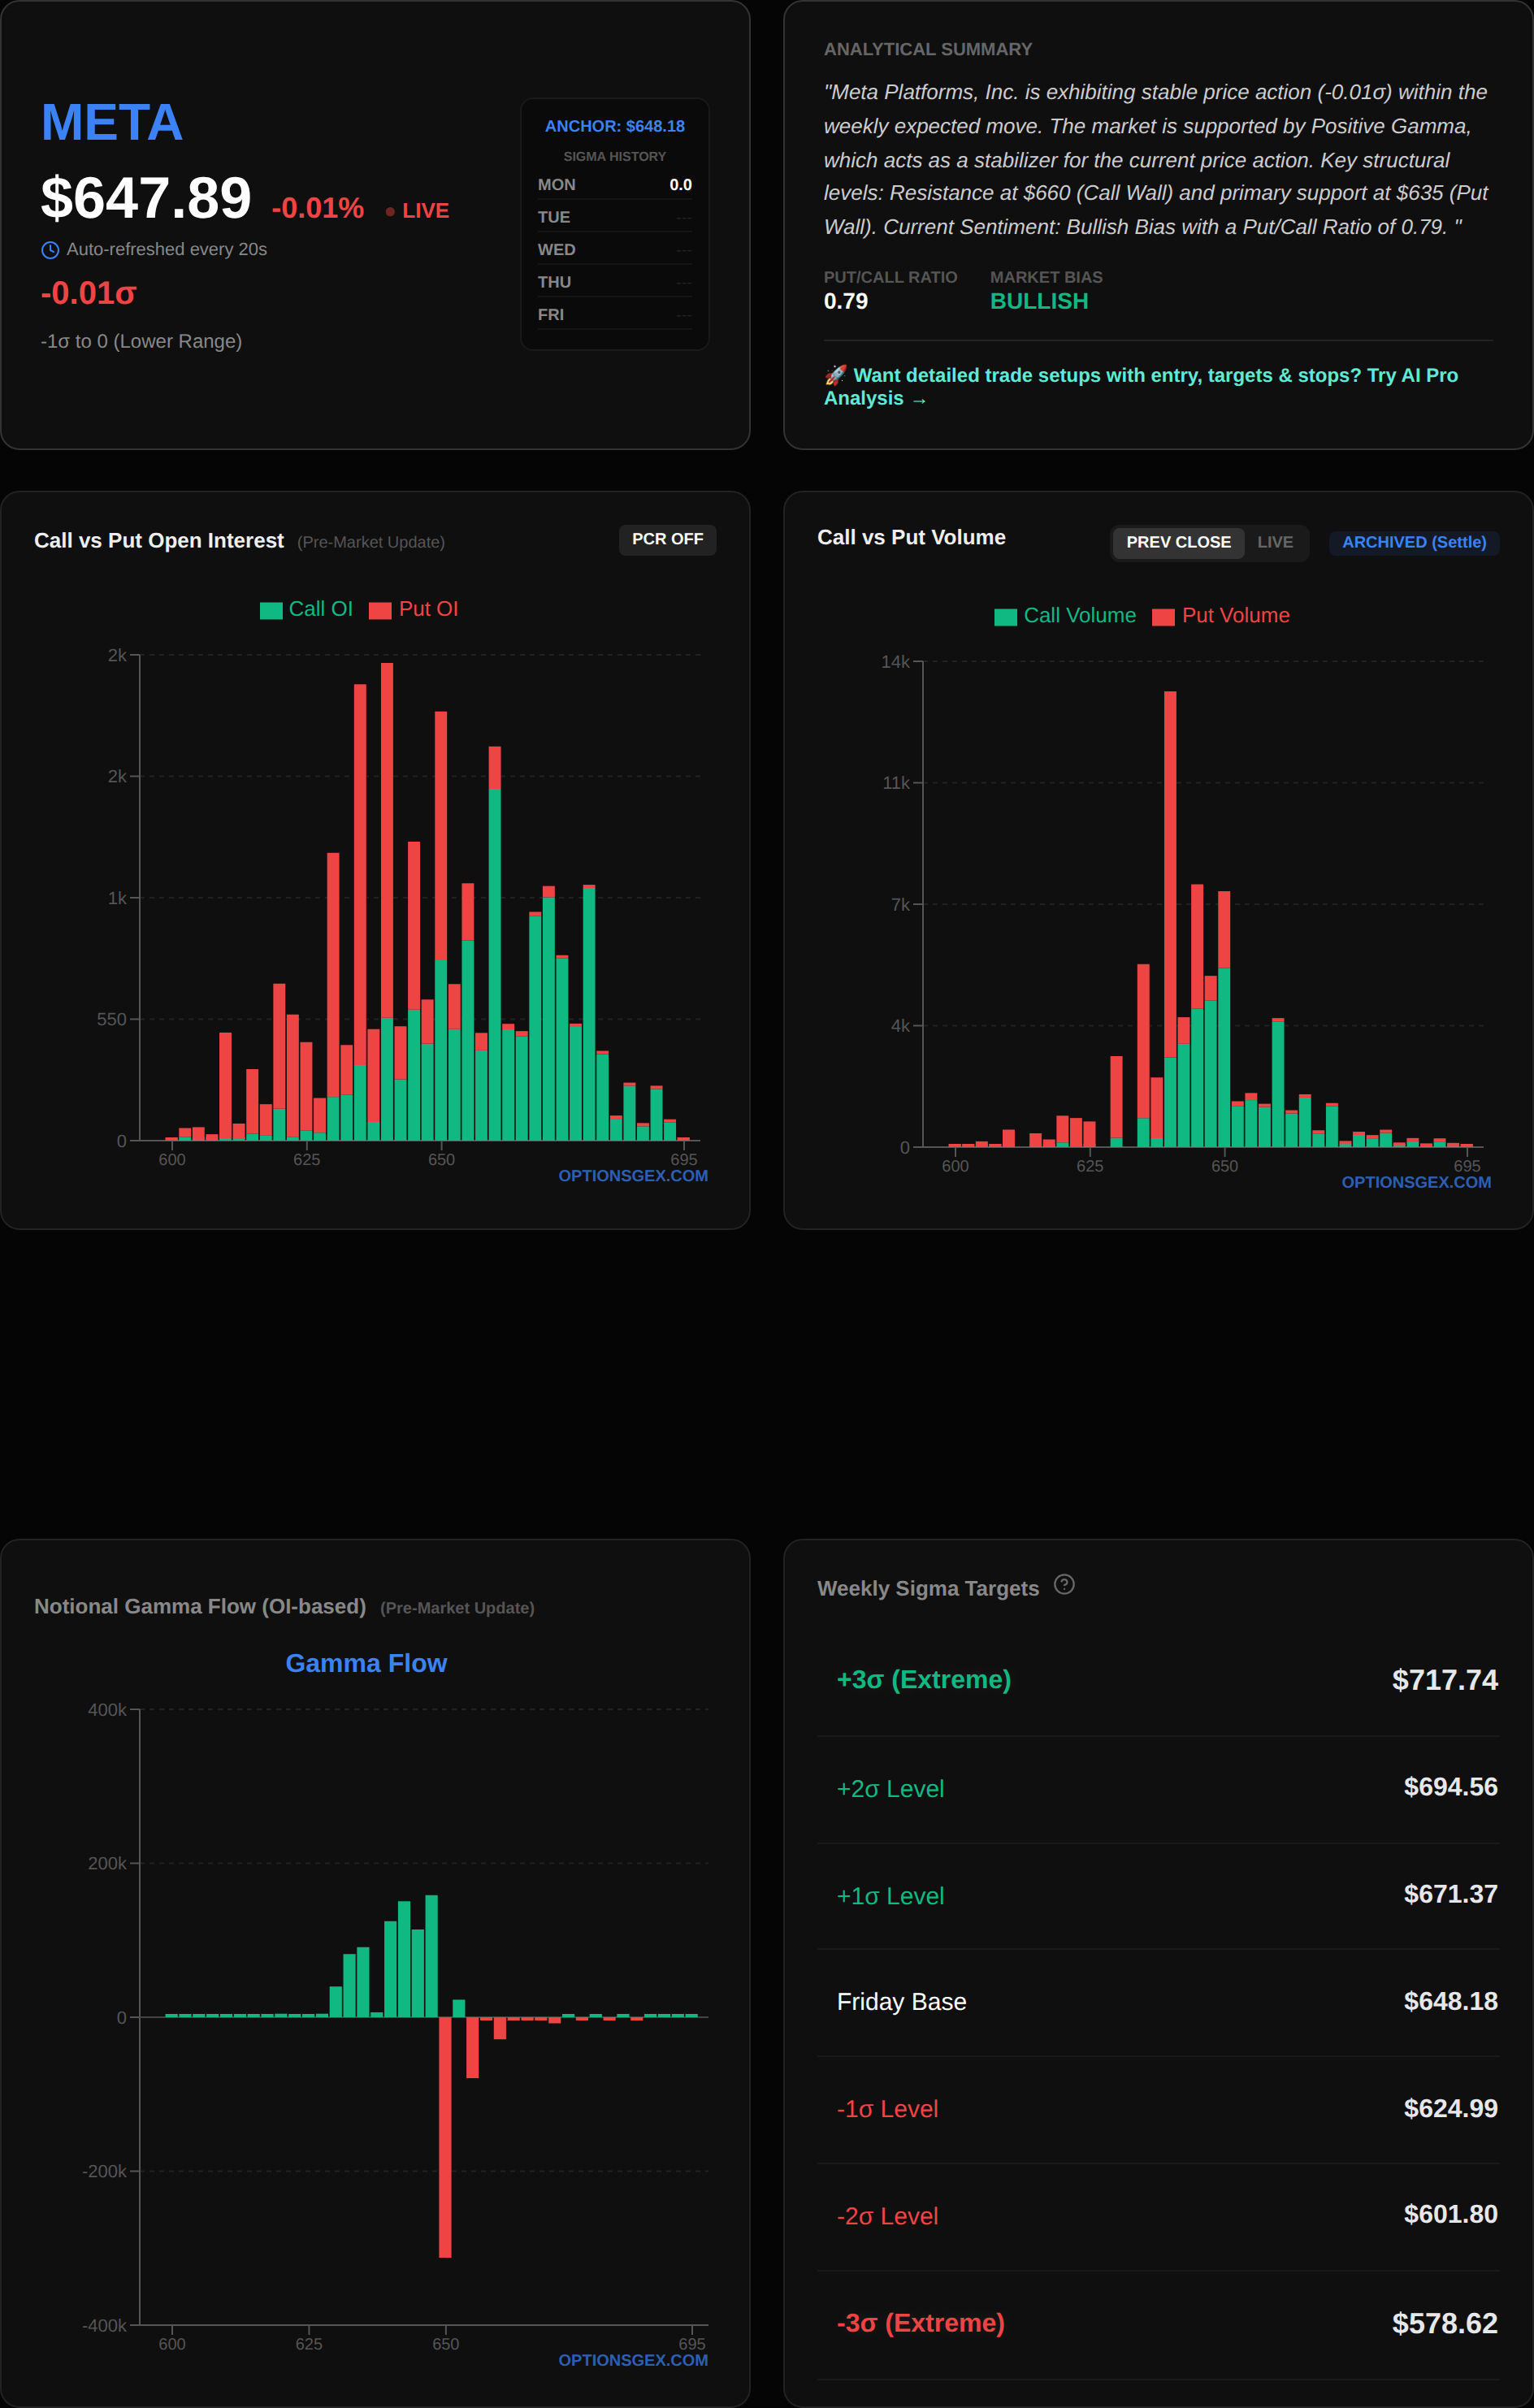
Meta Platforms (META) is exhibiting a mix of unusual put and call activity, suggesting a battle for direction at its current spot price of $648.35.
The most significant activity is seen in the PUT Strike $640, with 10550 contracts traded against an OI of 1607, a remarkable 6.6x normal volume. This substantial put buying, with an IV of 6.3%, indicates a strong bearish sentiment or demand for downside protection just below the current spot. Concurrently, there's notable call activity at the CALL Strike $650, with 5163 contracts traded against an OI of 817, a 6.3x normal volume, at a very low IV of 1.6%. This could be a speculative bullish bet or a hedge against existing short positions. Another significant put strike is $645, seeing 3592 contracts traded against an OI of 761, or 4.7x normal volume, with an IV of 3.1%.
Similar to TSLA, the gamma for all these specific flagged strikes is 0.0000, meaning their immediate impact on dealer hedging is limited. However, the concentration of both puts and calls around the current spot price suggests a high level of uncertainty and potential for a sharp move once a direction is established. The overall Net GEX for META is $0.00 Billion, implying sensitivity to its own Zero Gamma Pivot. The Call Wall at $660 and Put Wall at $635 define the broader range, with the $640 and $645 put strikes acting as immediate downside magnets if the stock starts to decline.
Risk Warning: The conflicting signals from the high volume in both puts and calls near the spot price suggest significant uncertainty. A break below $645 could accelerate downside towards the $640 put concentration, while a break above $650 could trigger a short-term rally. Traders should exercise extreme caution and wait for a clear break above $650 or below $645 before taking a directional stance, as META is currently in a highly contested zone.
⚠️ TRADING SCENARIOS
Today's market, characterized by SPY and QQQ hovering at their Zero Gamma Pivots, demands precise entry and exit strategies. The VIX at 22.14 confirms an environment ripe for volatility expansion.
🟢 Bullish Case:
The bullish scenario for SPY activates if it convincingly breaks and sustains above its Zero Gamma Pivot of $683.00. A sustained push above this level would likely shift market makers into a long-gamma position, prompting them to buy into strength and sell into weakness. This positive gamma effect would dampen downside volatility and create a more stable upward trajectory. The initial target would be the Max Pain level of $686, where options structures typically exert a magnetizing effect. If momentum continues, the next significant resistance is the Call Wall at $695. For QQQ, a bullish trigger would be a sustained move above its Zero Gamma Pivot of $604.00, aiming for the Max Pain of $607, and then the Call Wall at $617.
🔴 Bearish Case:
The bearish scenario unfolds if SPY fails to hold its Zero Gamma Pivot of $683.00 and definitively breaks below it, especially if coupled with increasing selling pressure. A move below $683.00 would likely push market makers into a short-gamma position, forcing them to sell into weakness to re-hedge their deltas. This would accelerate downside momentum. The immediate support level to watch is the Put Wall at $670. A break of this level would indicate significant bearish conviction and open the door for further declines. For QQQ, a break below its Zero Gamma Pivot of $604.00 could quickly lead to a test of its Put Wall at $605. Given the proximity of the QQQ Put Wall to the Zero Gamma Pivot, a breach here would be particularly significant, indicating a rapid unwinding of support.
🟡 Choppy/Range-Bound Case:
A choppy or range-bound scenario is most likely if both SPY and QQQ remain tightly coiled around their respective Zero Gamma Pivots of $683.00 and $604.00. In this environment, market makers would remain largely gamma-neutral, leading to price action that oscillates within a tight range as they balance their books. For SPY, this would translate into trading between approximately $680 (just below the pivot) and $686 (Max Pain). For QQQ, the expected range would be between $602 and $607 (Max Pain). This scenario is plausible if there are no major directional catalysts and the market remains in a state of equilibrium near the gamma flip point. Traders should anticipate frequent reversals and potential false breakouts in such an environment.


Comments
Post a Comment