SPY: The $683.37 Pivot Holds the Key to Today's Volatility Expansion
SPY: The $683.37 Pivot Holds the Key to Today's Volatility Expansion
> ⚠️ Data Notice: Yahoo Finance is currently experiencing options data issues, causing delayed or missing updates for many tickers. We have implemented safety warnings on our site. Normal data should return early next week.
📊 MARKET OVERVIEW
The options market enters today's session exhibiting a distinctly negative gamma profile for both benchmark indices, SPY and QQQ, signaling an environment ripe for amplified volatility. SPY currently registers a Net GEX of $-5.14 Billion, while QQQ shows a Net GEX of $-0.85 Billion. This collective negative gamma indicates that market makers are, on balance, short gamma, a condition that typically leads to increased price momentum and reduced dampening of price moves. When dealers are short gamma, they must buy into strength and sell into weakness to maintain a delta-neutral position. This dynamic acts as an accelerant to existing price trends, rather than a dampener.
The VIX, having closed at 20.39, is already elevated, aligning with this negative gamma landscape. A negative GEX environment suggests that any significant directional move in SPY or QQQ will likely be exacerbated by dealer hedging flows, leading to larger price swings. This is in stark contrast to a positive gamma regime, where market makers would absorb volatility by selling into rallies and buying into dips. The current setup implies that if the market breaks a key level, the ensuing move could be swift and pronounced.
Furthermore, the put/call imbalance ratio for SPY stands at a significant 2.74, indicating a heavy skew towards put open interest relative to call open interest. This substantial put positioning contributes to the negative gamma profile, as large blocks of out-of-the-money puts require dynamic hedging from market makers. For QQQ, the put/call imbalance ratio is 1.33, also leaning towards puts but less dramatically than SPY. This overall put dominance underscores a market that has either built in substantial downside protection or is actively speculating on further declines, creating a self-reinforcing feedback loop if downside momentum materializes. With both indices positioned in negative gamma, traders should anticipate a "fast market" environment where initial directional triggers can lead to outsized moves.
🎯 KEY STRUCTURAL LEVELS
Understanding the precise structural levels derived from options open interest is paramount for navigating today's market. These levels, driven by market maker hedging requirements, often act as significant gravitational pulls or impenetrable barriers.
| Index | Spot Price | Net GEX | Call Wall (Resistance) | Put Wall (Support) | Zero Gamma Pivot (Vol Expansion) | Max Pain |
| SPY | $683.91 | $-5.14 Billion | $700 | $540 | $683.37 | $689 |
| QQQ | $605.97 | $-0.85 Billion | $620 | $600 | $605.59 | $610 |
SPY Analysis:
The current SPY spot price of $683.91 is trading precariously close to its Zero Gamma Pivot at $683.37. This level is critical; a sustained move below the Zero Gamma Pivot will likely trigger an expansion in volatility to the downside, as market makers, being short gamma, will need to sell into falling prices to maintain their delta-neutral positions. Conversely, a firm hold and rebound from this level could see a temporary stabilization. The Major Call Wall at $700 represents a formidable resistance, where a significant cluster of call options has accumulated. Market makers holding short calls at this strike will likely defend this level aggressively by selling futures or underlying shares as price approaches, effectively capping upside moves. On the downside, the Major Put Wall at $540 acts as robust support, though it is quite distant from current levels, suggesting limited immediate downside protection from options flows alone until much lower prices are reached. Max Pain for SPY is $689, indicating the price point at which the largest number of options contracts expire worthless, maximizing losses for options holders and maximizing profits for options writers (dealers).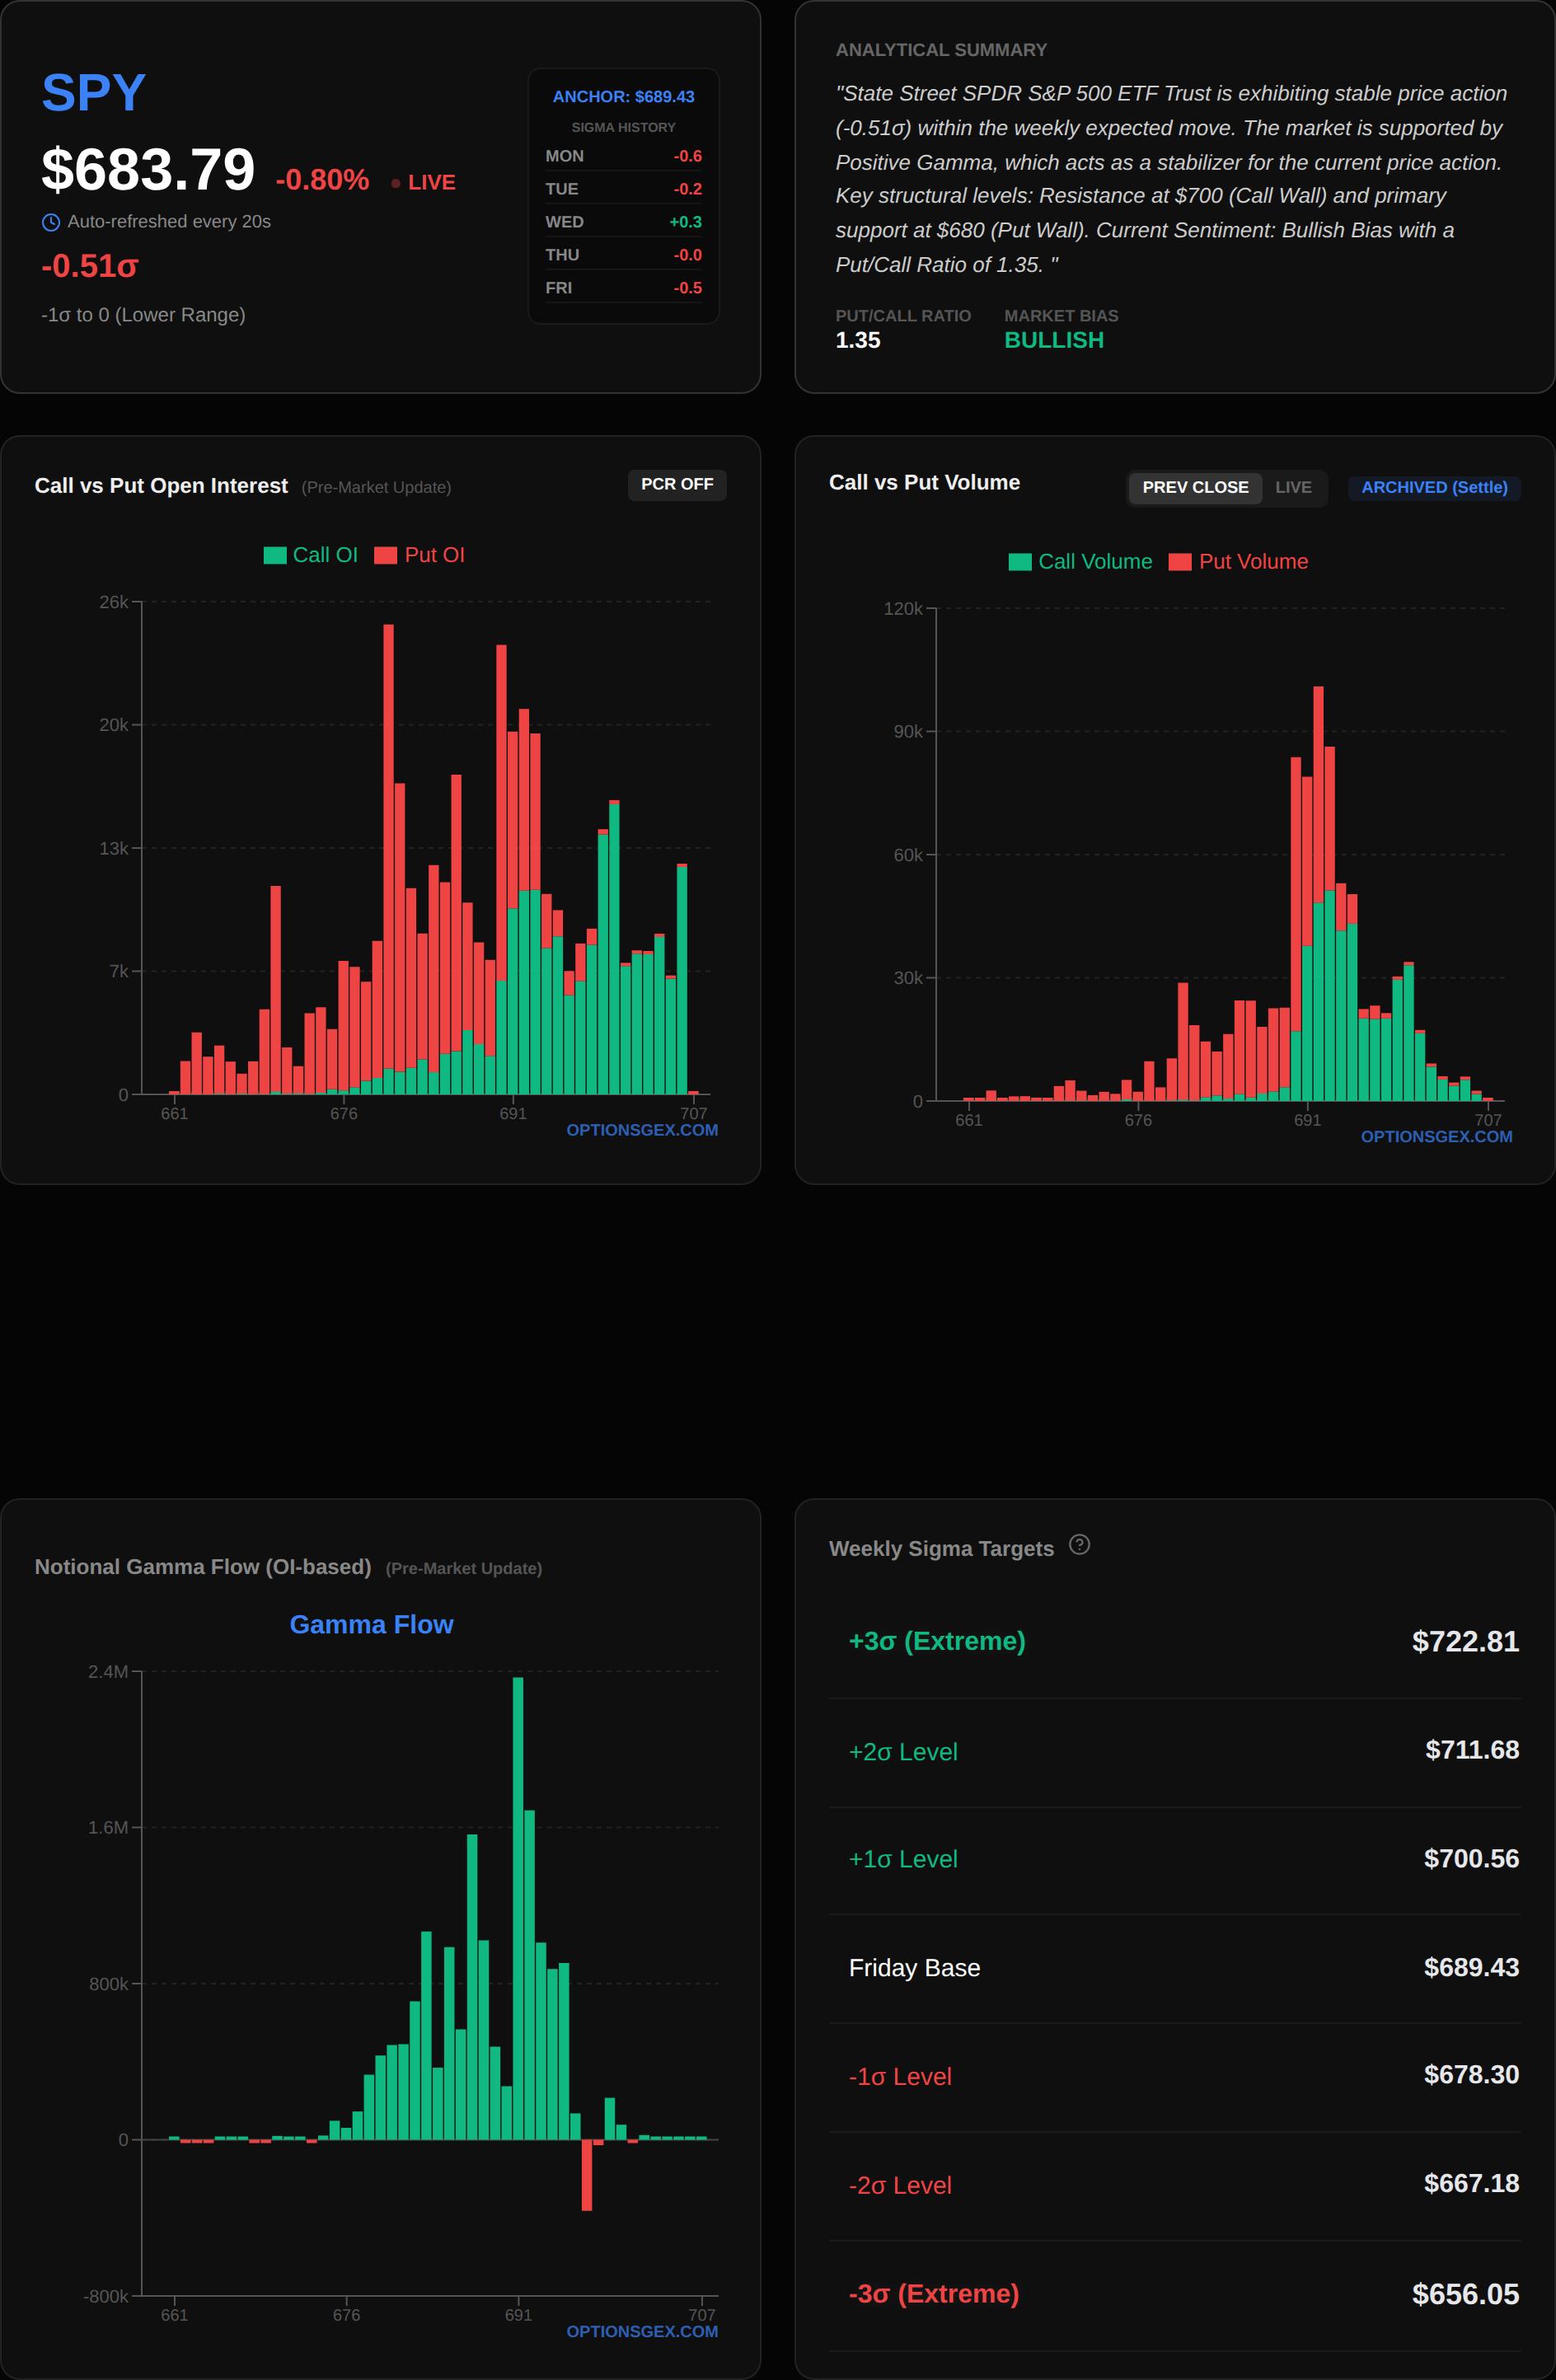
QQQ Analysis:
QQQ, currently at $605.97, is also hovering around its Zero Gamma Pivot of $605.59. Similar to SPY, a breach of this level could ignite volatility. The Major Call Wall at $620 serves as a strong overhead resistance, where dealer short call positions will likely create selling pressure if QQQ attempts to advance. The Major Put Wall at $600 provides immediate and significant support. This level is particularly important given its proximity to the current spot price. A break below $600 would be a bearish signal, potentially accelerating downside momentum due to dealer short gamma hedging. Max Pain for QQQ is $610, which implies a slight upside drift from current levels could be favored by options writers.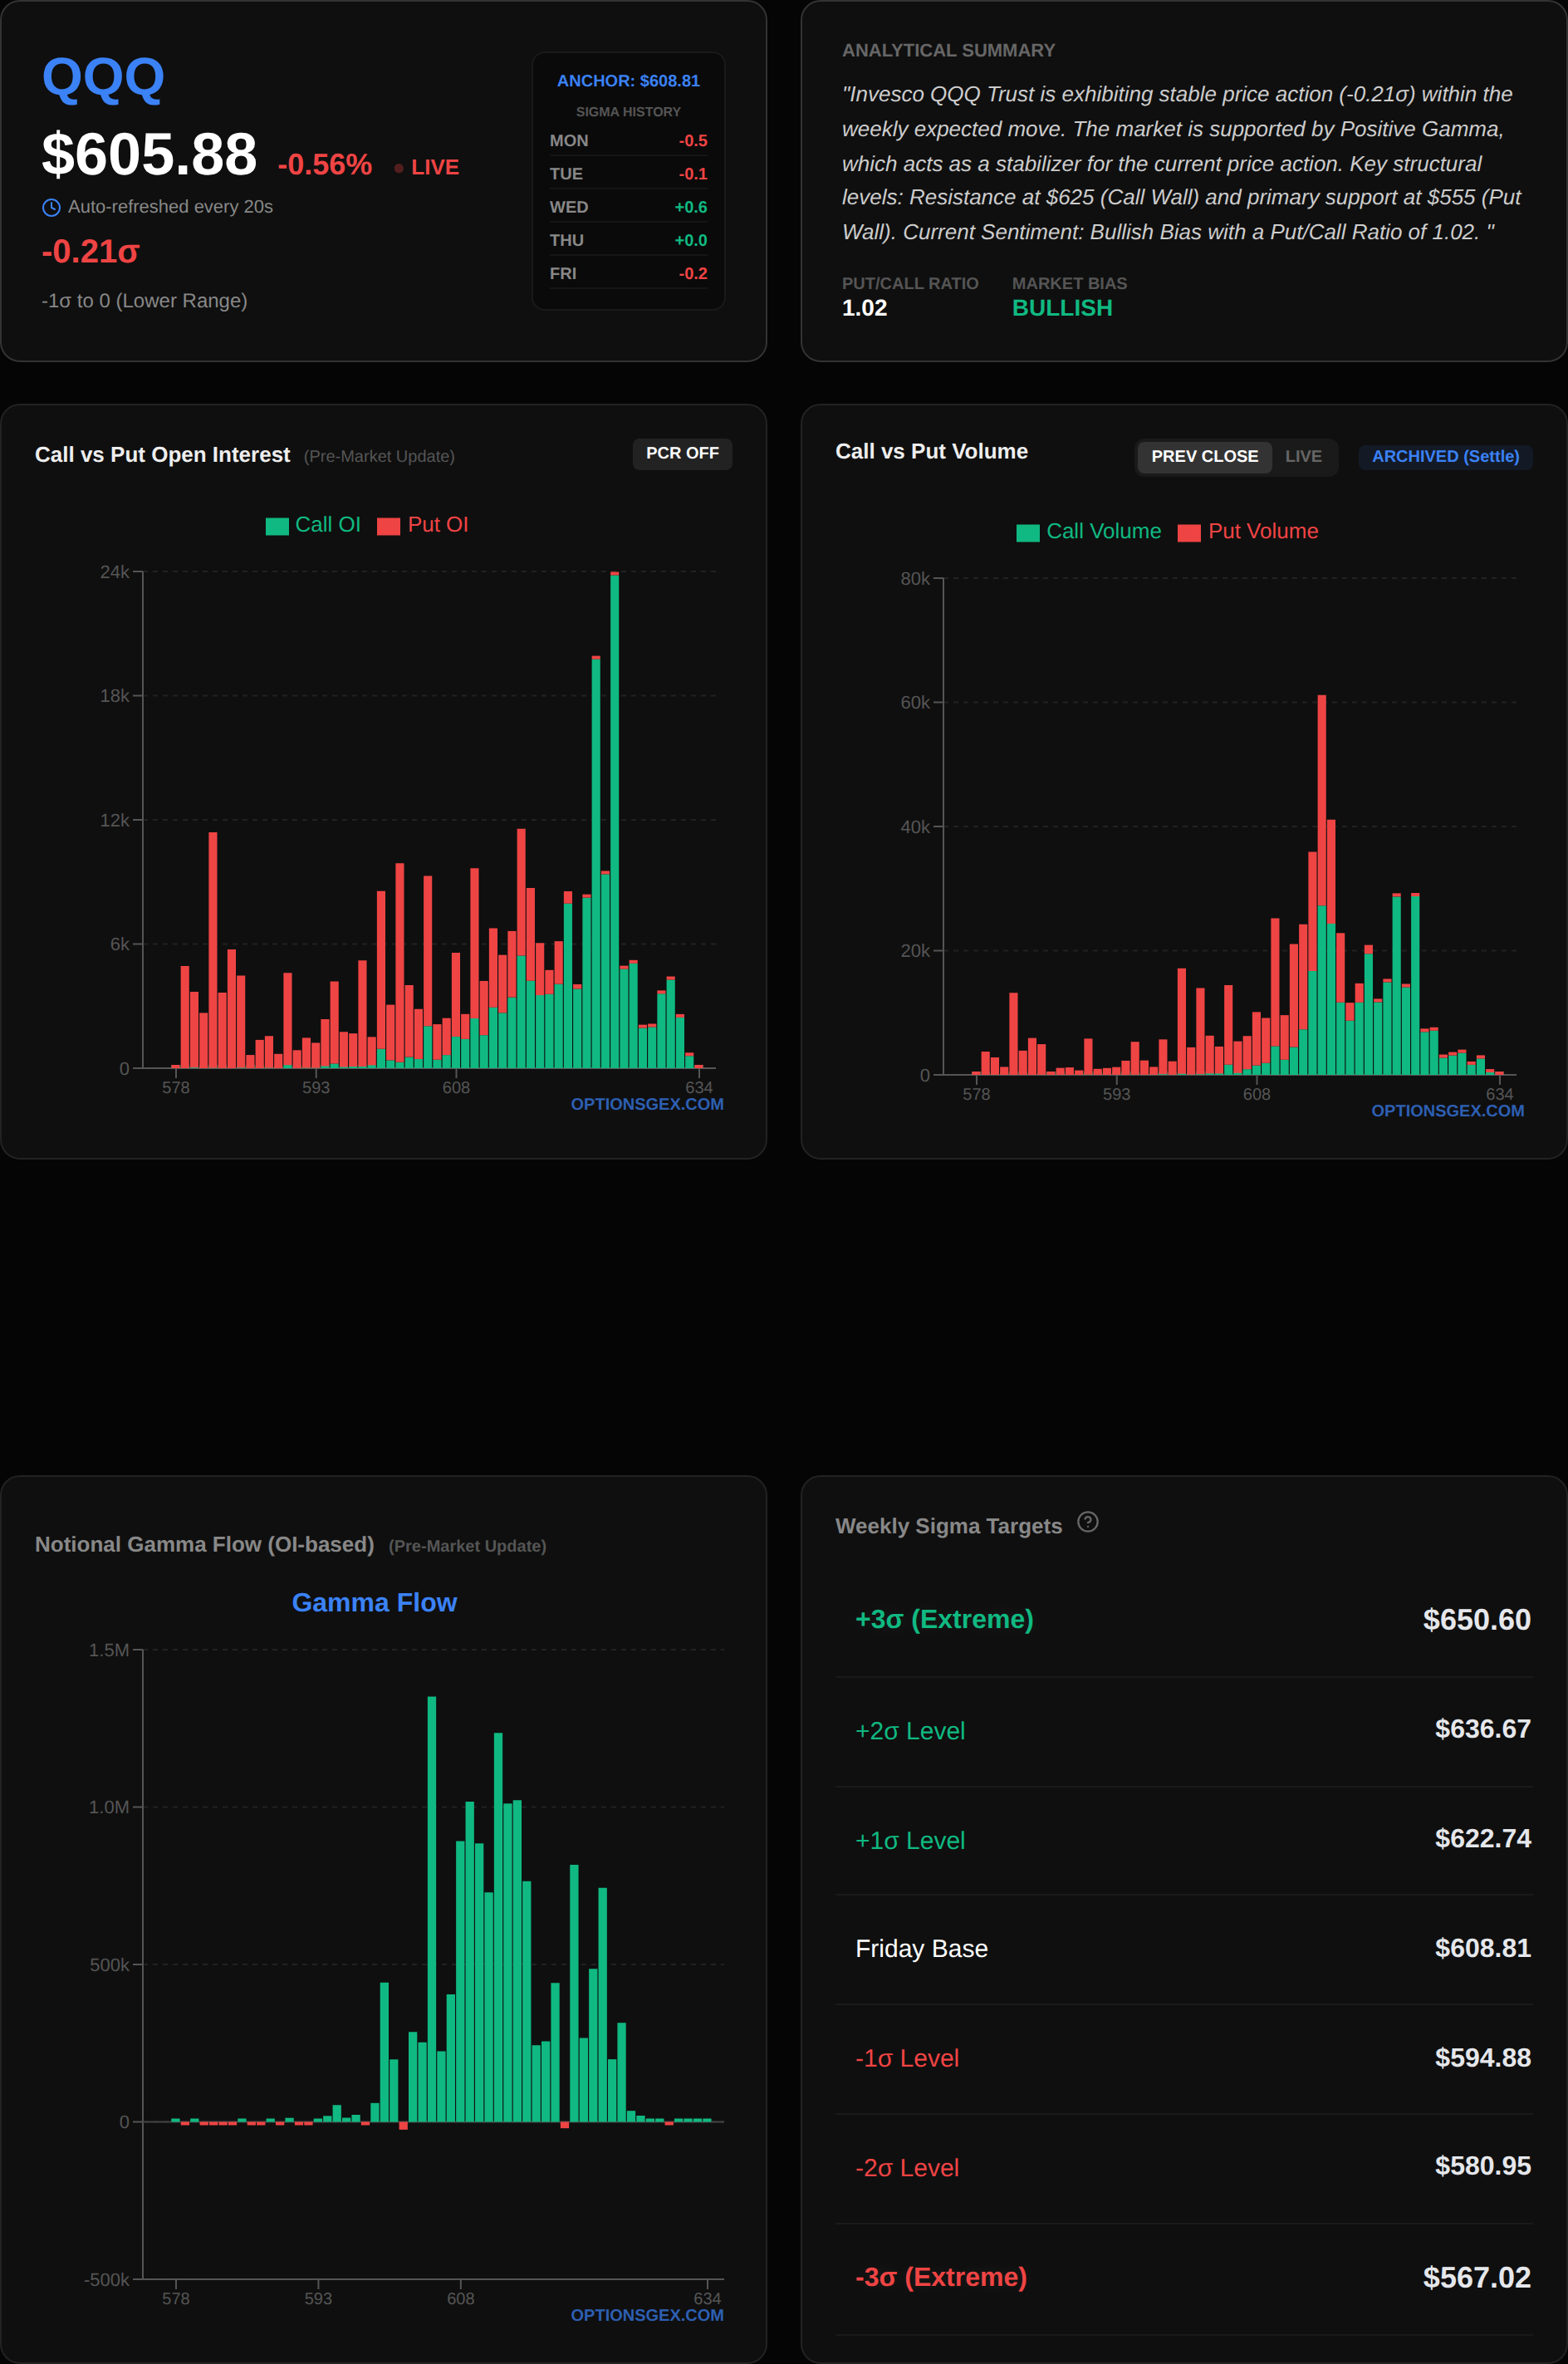
These levels are not arbitrary; they are directly derived from the aggregated open interest and reflect the collective positioning of options traders, which in turn dictates the hedging activities of market makers. Monitoring price action around these precise levels will be crucial for discerning today's market direction and potential volatility.
🔥 UNUSUAL FLOW RADAR: Today's Smart Money Targets
Today's options flow data reveals significant speculative activity in META and TSLA, indicating potential directional plays by sophisticated participants. The high volume-to-open interest ratios suggest new, aggressive positioning rather than simple position rolling or closing.
📊 Analyze any ticker yourself: Visit optionsgex.com to view live GEX profiles and Sigma levels for over 500 stocks.
META - Unusual Flow Alert
META, trading at $642.10, has seen a conspicuous surge in options activity, particularly on the call side, despite its overall Net GEX being marginally negative at $-0.07 Billion.- CALL Strike $642.5: Volume of 9872 vs. OI of 190, representing a staggering 52.0x normal activity. The gamma at this strike is 0.0408, and IV is 29.1%.
- CALL Strike $647.5: Volume of 8213 vs. OI of 429, translating to 19.1x normal activity. Gamma here is 0.0418, with IV at 22.1%.
- PUT Strike $640: Volume of 21838 vs. OI of 3119, showing 7.0x normal activity. This strike has a high gamma of 0.0846 and IV of 12.2%.
The extreme volume-to-OI ratios on the $642.5 and $647.5 calls are highly significant. A ratio of 52x or 19x indicates that a substantial amount of new capital is flowing into these specific strikes, far exceeding existing open interest. This is a strong signal of aggressive bullish conviction, potentially anticipating a near-term upside breakout for META. The gamma at these strikes, while positive, is not exceptionally high, suggesting that while price could accelerate, the primary driver is likely outright directional bets rather than gamma hedging. However, the high volume on the $640 put, with its significantly higher gamma of 0.0846, suggests active downside protection or outright bearish speculation just below the current spot. This creates a fascinating dynamic: strong bullish call activity clashing with robust put positioning.
Actionable Trade Idea: Given the overwhelming call volume relative to OI, a bullish breakout above $642.50 could trigger a squeeze. A speculative long position on META calls, targeting the $647.50 strike, could be considered. Entry: $642.50 break with confirmation. Stop-loss: A retest and failure below $640. The risk here is that the put activity could stem from institutional hedging against long equity positions, or it could be outright bearish bets, implying a potential battleground around $640 - $642.50. Traders should monitor the $640 put wall closely; a break below it could invalidate the bullish call thesis.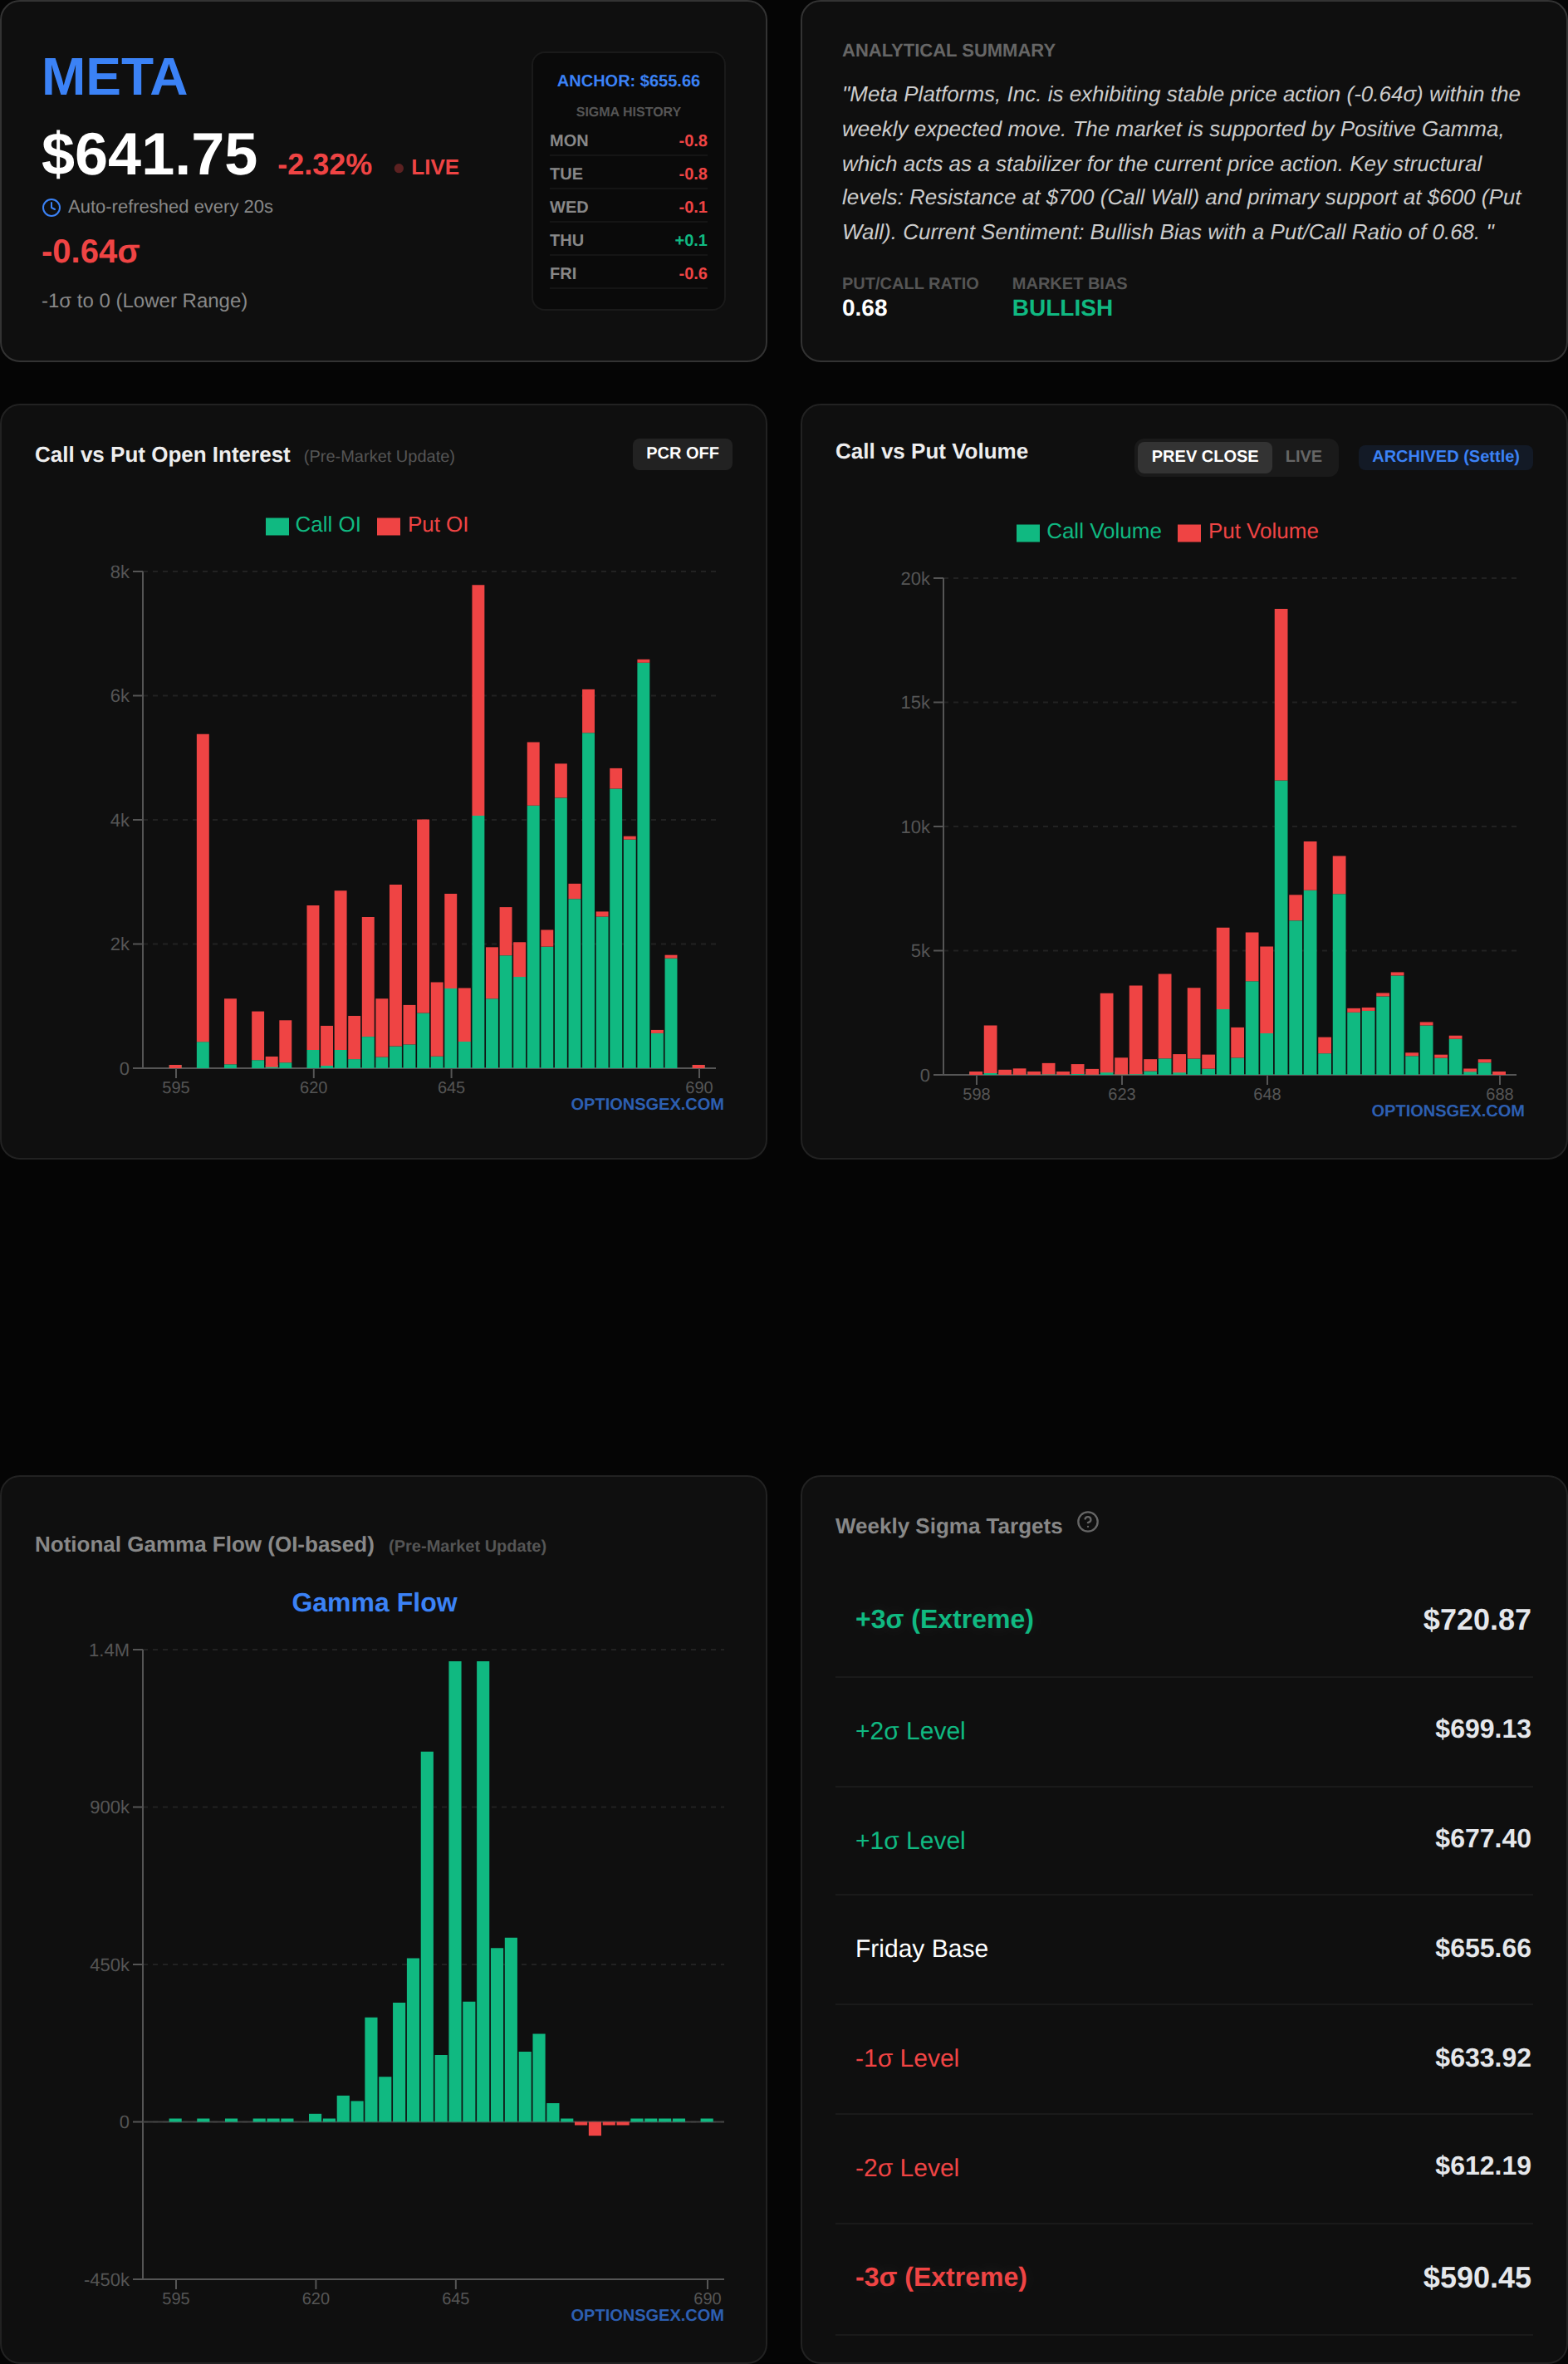
TSLA - Unusual Flow Alert
TSLA, trading at $399.51, is exhibiting extremely high call option activity, particularly just above its current price, with an overall Net GEX of $-0.42 Billion. This negative GEX suggests that if these calls are primarily bought, they could contribute to an accelerated upside move.- CALL Strike $402.5: Volume of 45404 vs. OI of 1912, a 23.7x normal activity. Gamma: 0.0612, IV: 27.5%.
- CALL Strike $405: Volume of 118933 vs. OI of 5915, indicating 20.1x normal activity. Gamma: 0.0450, IV: 24.9%.
- CALL Strike $407.5: Volume of 72356 vs. OI of 4563, showing 15.9x normal activity. Gamma: 0.0249, IV: 25.0%.
The sheer magnitude of call volume across these strikes, relative to existing open interest, unequivocally points to aggressive bullish speculation. The $405 strike, in particular, saw nearly 119,000 contracts trade against only 5,915 in open interest, signifying a massive influx of new long call positions. Gamma is clustered around these strikes, particularly at $402.5 with 0.0612. If TSLA starts moving higher and these calls move in-the-money, market makers who are short these calls will be forced to buy TSLA shares to hedge their delta, creating a positive feedback loop that could propel the stock upwards rapidly. The negative overall GEX for TSLA further amplifies this potential for an accelerated move.
Risk Warning/Scenario: The concentration of gamma slightly above the current price means that if TSLA can breach and hold above $400, the path to $405 and potentially $407.50 could be swift. However, if these calls are primarily speculative and TSLA fails to gain upward momentum, the implied volatility could quickly deflate, leading to significant losses for options buyers. Given the magnitude of this flow, a move above $400 could initiate a "gamma squeeze" as dealers are forced to cover their short call deltas. Traders should be prepared for potential rapid price appreciation if $400 is firmly breached. However, a failure to break $400 could see these options lose value rapidly. The $150 Put Wall is too distant to offer immediate options-derived support.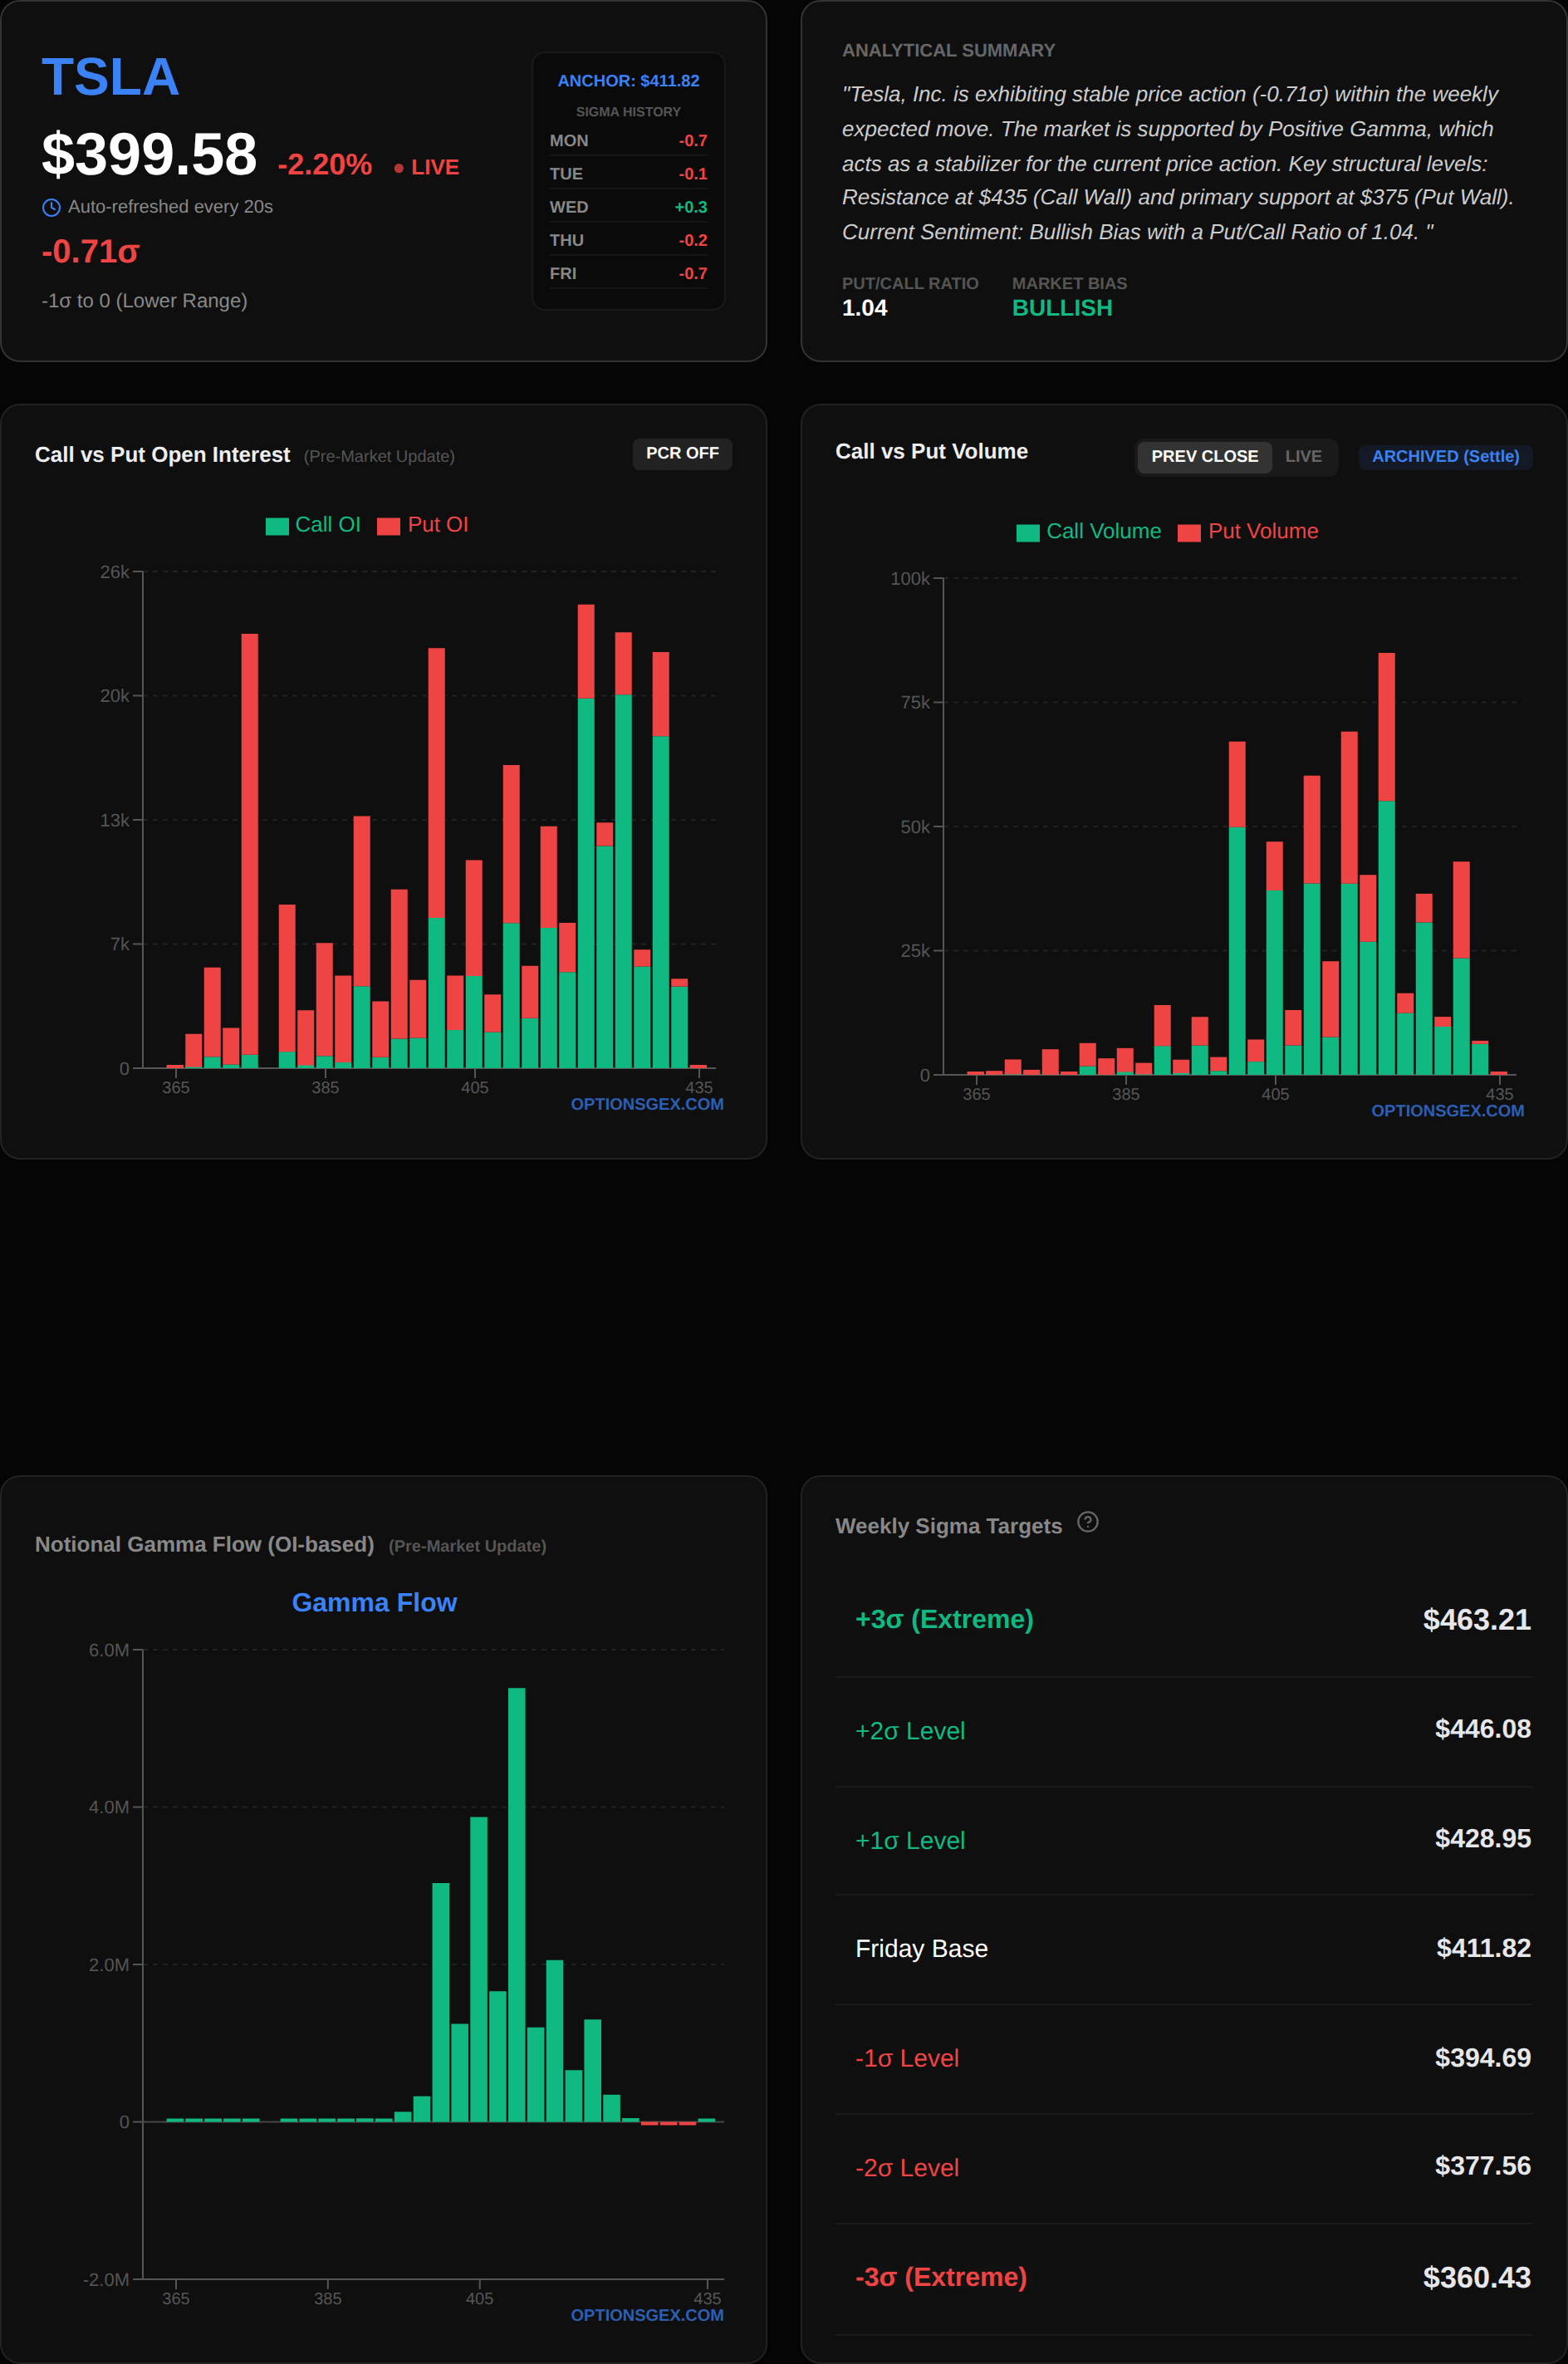
⚠️ TRADING SCENARIOS
Given the current negative gamma environment and the proximity of both SPY and QQQ to their respective Zero Gamma Pivots, today's trading action is poised for significant directional movement once key levels are breached.


Comments
Post a Comment